
In this workshop you'll learn how to make a chart generator using Chart.js, a free open-source JavaScript library for data visualization. Follow along and see how easy it is!
Here you can find a live demo and here, you will find the source code.
Set Up
This workshop requires a very basic knowledge of the following languages: HTML & JS. Don’t worry if you get stuck at some point in the workshop, everything is explained for you to understand!
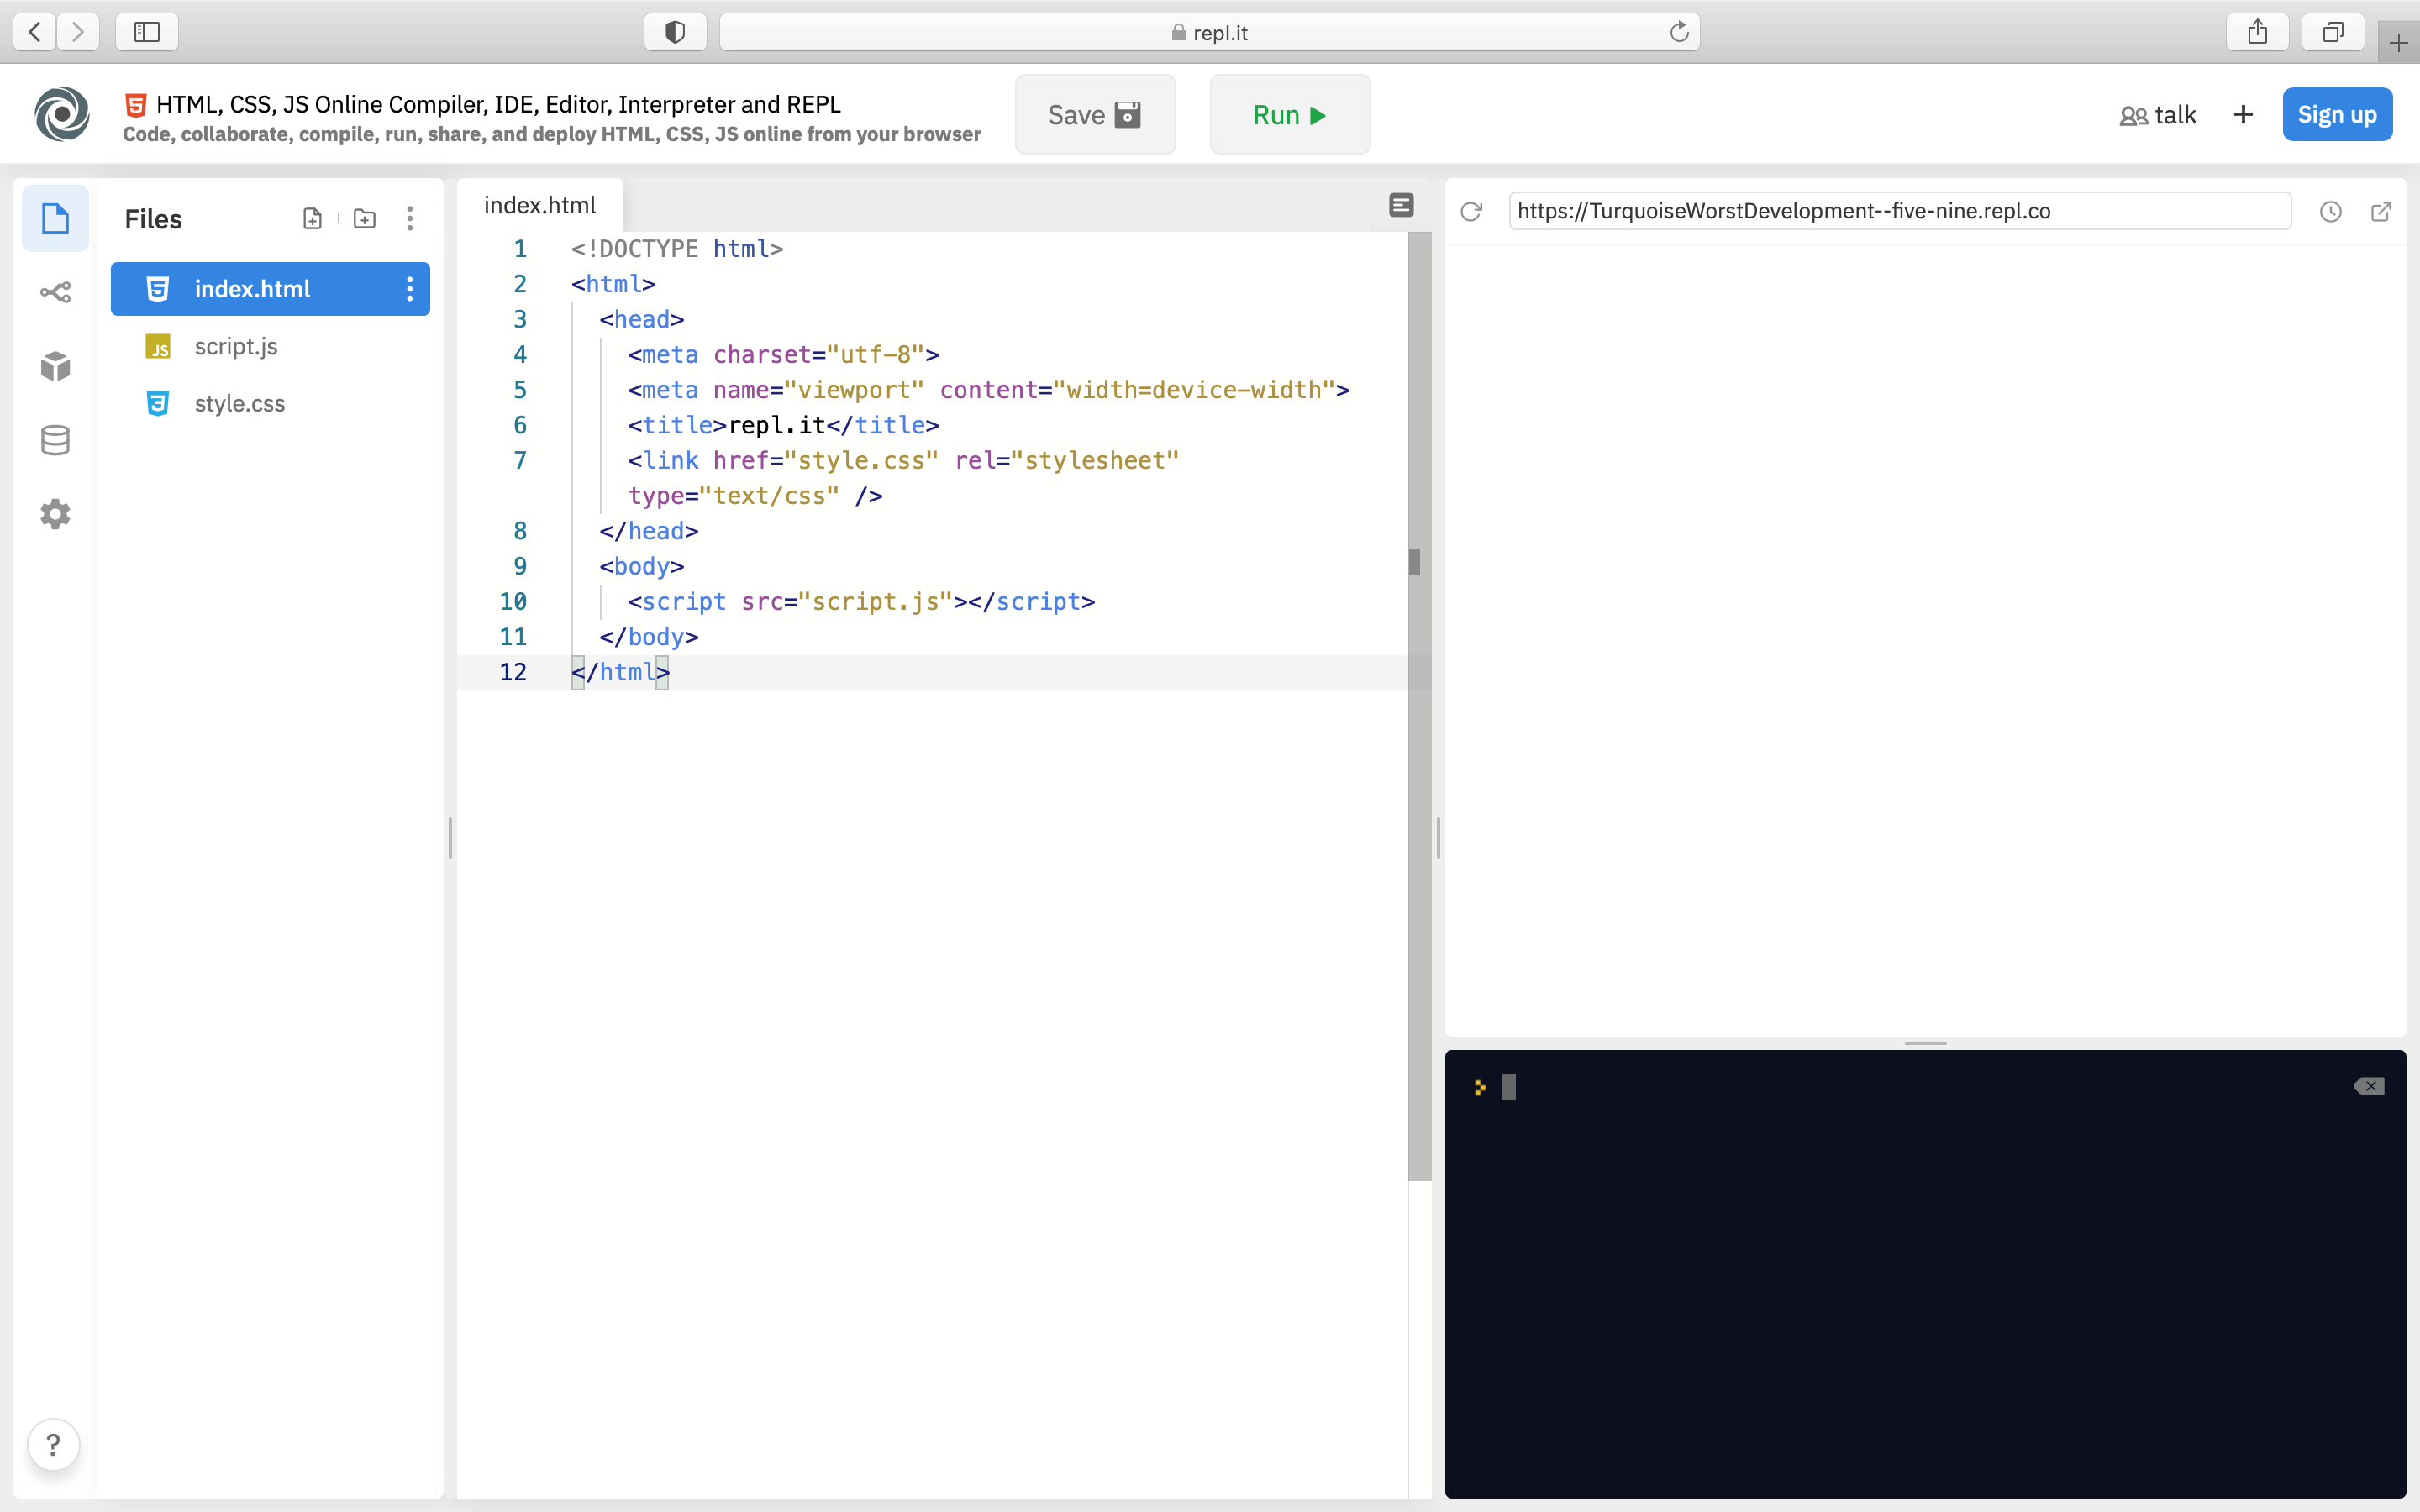
For this workshop we will use Repl.it, a free, online code editor. Click here to create a coding environment.
HTML
Alright, the first thing we have to do is to load Chart.js into our HTML document. To do this, we are going to paste the following code inside of our <head> tag.
<script src="https://cdnjs.cloudflare.com/ajax/libs/Chart.js/2.9.4/Chart.min.js"></script>
This allows us to use Chart.js without having to download it. Learn about CDNs here.
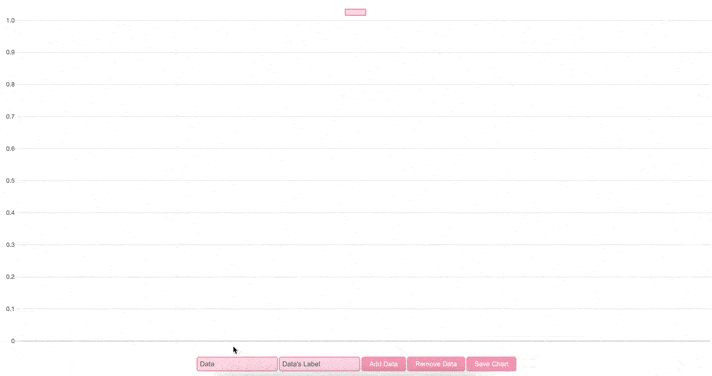
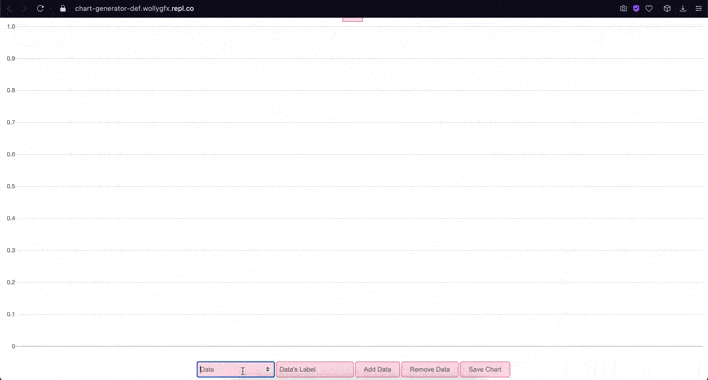
The next thing we have to do is to create a canvas element inside of our body tag, and give it an id. Our chart will be drawn in this canvas.
<canvas id="myChart"></canvas>
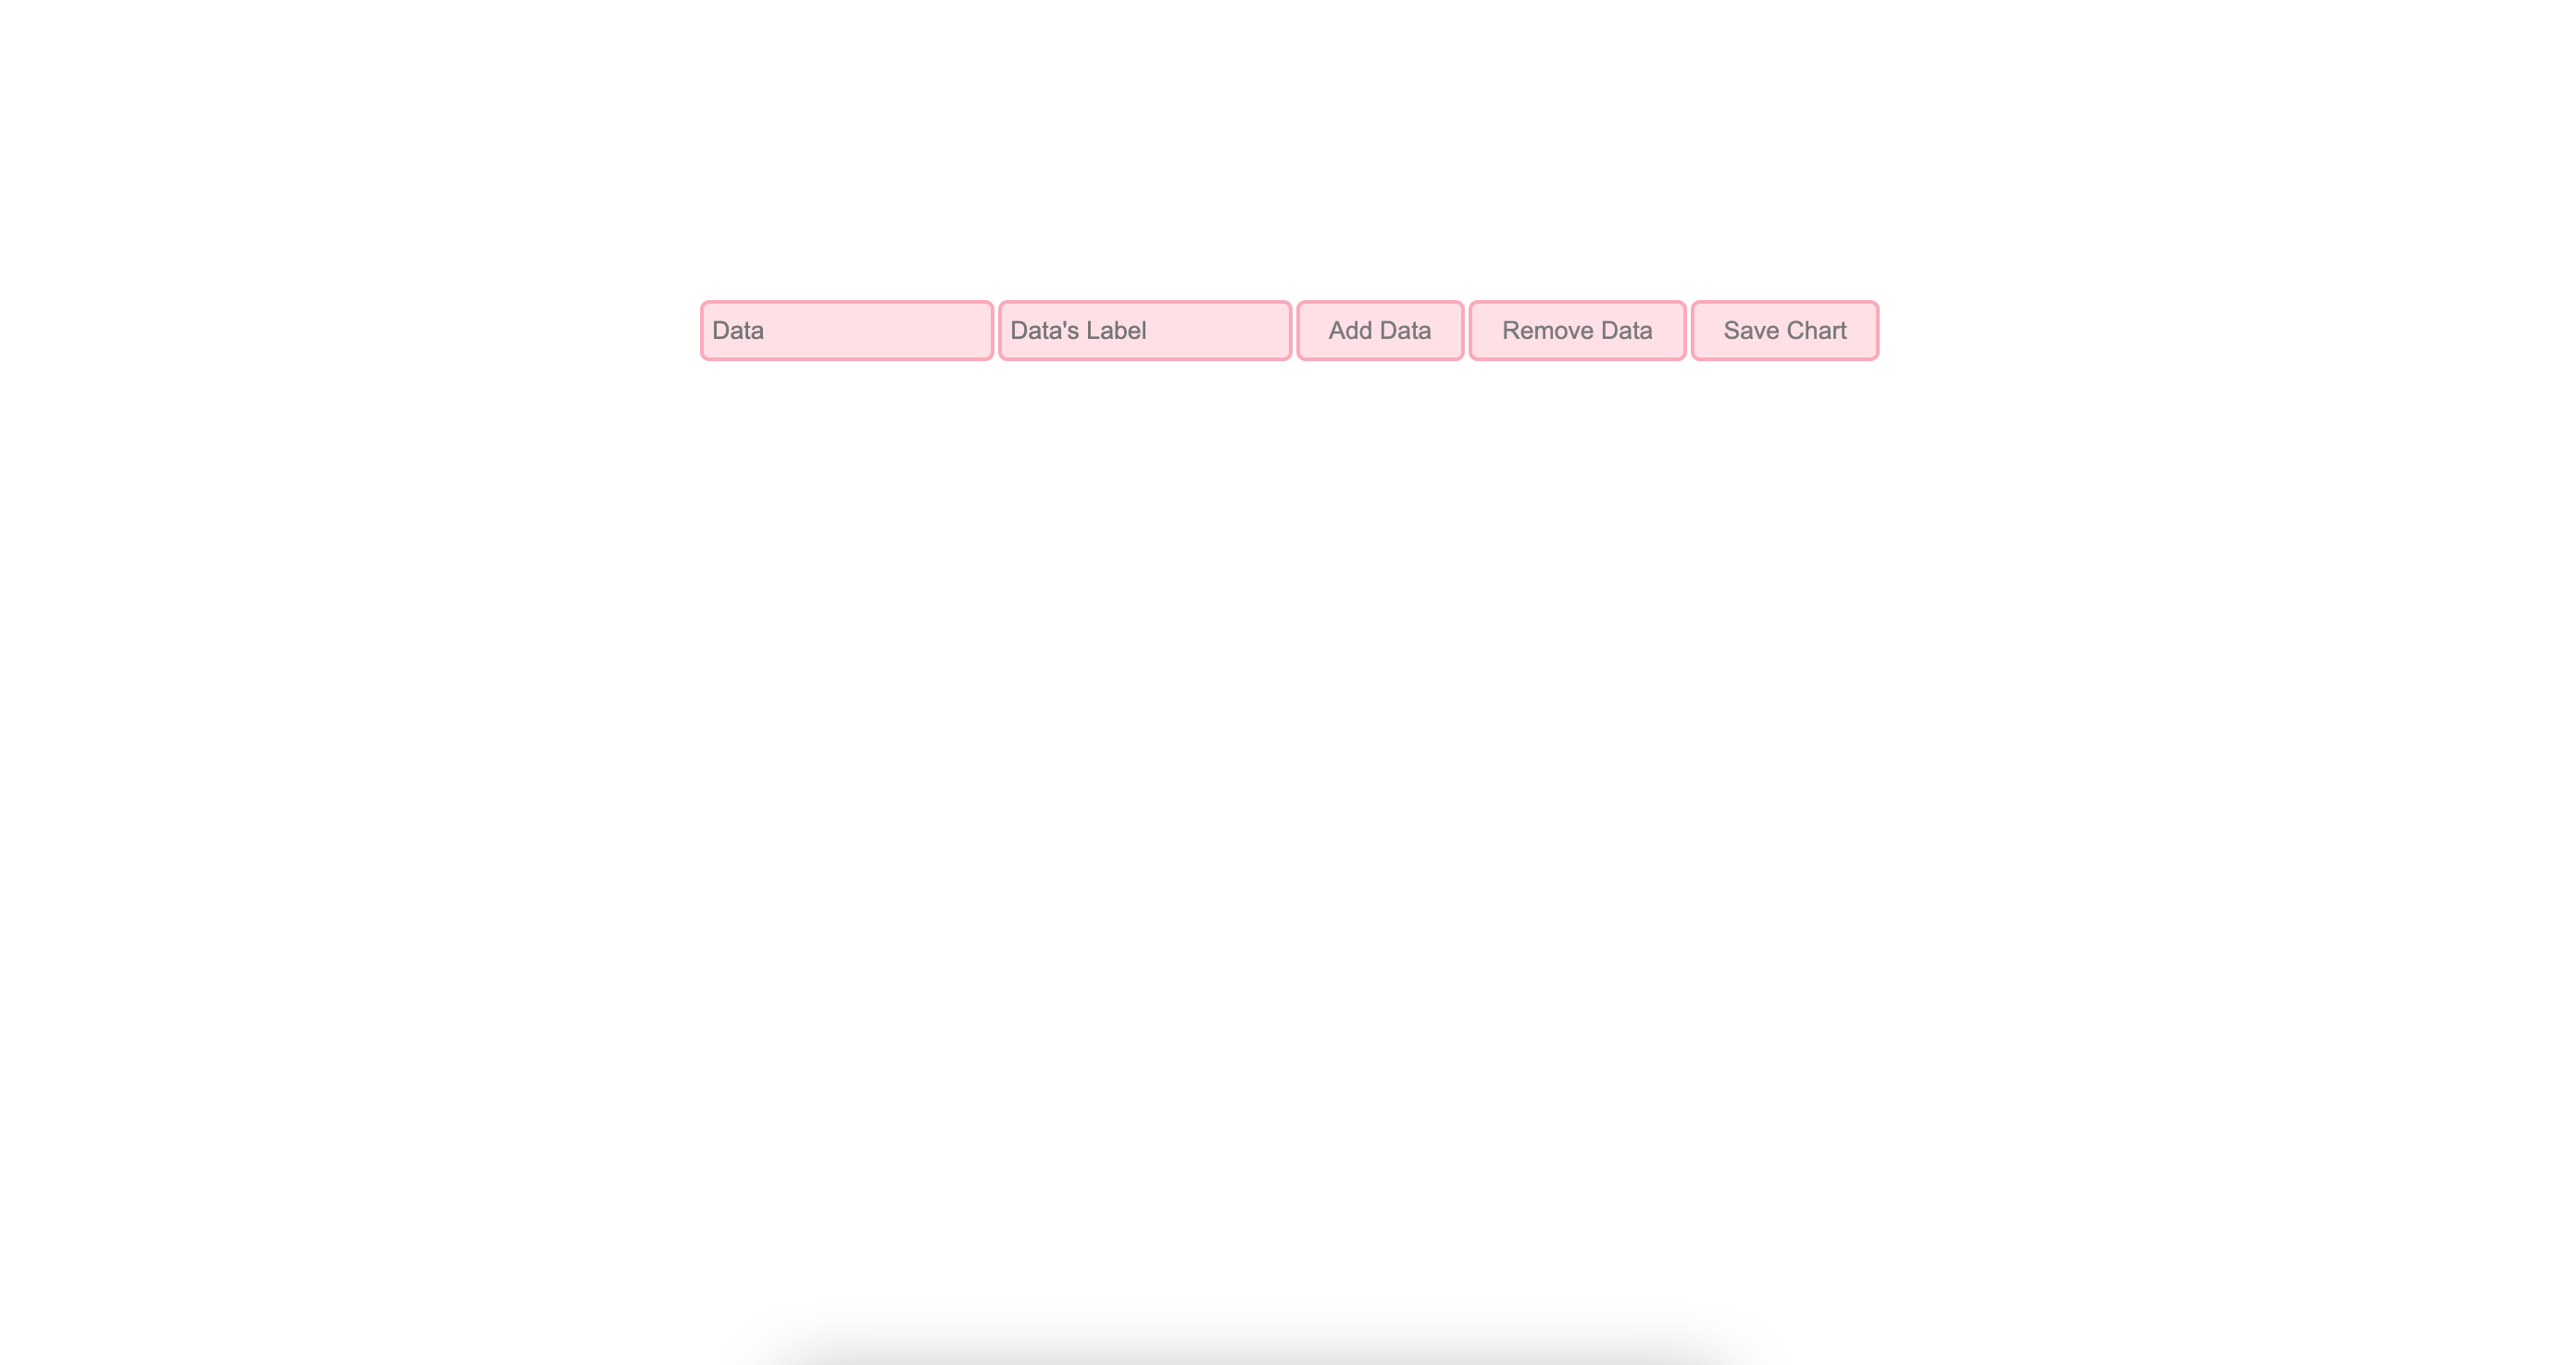
Additionally, we have to create inside of a div container, 2 input elements and 3 buttons with the following attributes and values.
<canvas id="myChart"></canvas>
<div>
  <input id="data" type="number" placeholder="Data">
  <input id="label" type="text" placeholder="Data's Label">

  <button onclick="addData(myChart)">Add Data</button>
  <button onclick="removeData(myChart)">Remove Data</button>
  <button onclick="saveCanvas()">Save Chart</button>
</div>
Notice that the 2 input elements have the attribute type but with different values. The number type is used to let the user enter a number, and the text type create basic single-line text fields. These inputs also have the attribute placeholder, which specifies a short hint that describes the expected value of an input field.
Also, you can see that the button elements have the onclick attribute. Tthis is actually an event handler. When the button is clicked, the specified function will run.
Here's how our HTML document looks so far:

CSS
Now that we have our HTML document ready, we should style it a little bit to make it look better. So, go ahead and click on the style.css file located in the Files tab.
First, we need to align all the input and button elements to the center.
div {
  display: flex;
  justify-content: center;
}
Let's break this down:
- The
displayproperty sets whether an element is treated as a block or inline element and the layout used for its children, such as flow layout, grid or flex. - The
justify-contentproperty defines how the browser distributes space between and around content items along the main-axis of a flex container, and the inline axis of a grid container. - In CSS, this is what's known as flexbox. Learn more about flexbox here!
When you click on the green Run button at the top of your repl, you'll see that the elements are perfectly aligned to the center.
Cool! – But our elements also look very boring right now. So let's style them a little bit!
button {
  background-color: #ffe0e6;
  border: 2px solid #fbabbb;
  border-radius: 5px;
  padding: 7px 16px;
  margin:0 2px 0 0;
  color: #7b7a7a;
  cursor: pointer;
}

input{
  background-color: #ffe0e6;
  border: 2px solid #fbabbb;
  border-radius: 5px;
  padding: 5px;
  margin:0 2px 0 0;
}
Here, we're giving the button and input elements:
- A background color
- A border (with a color too)
- a border radius
- And some other stuff that you can see here:
Cool, our website looks a lot better now!
JavaScript
Now, let's move to the fun part of the workshop. Go ahead and click on the script.js file located in the Files tab.

Setting up the canvas
First we'll need to get the context for our canvas. The canvas context is an object with properties and methods that you can use to render graphics inside the canvas element.
var canvas = document.getElementById('myChart');
var ctx = canvas.getContext('2d');
- First, we are creating a variable named
canvas, that gets the canvas element using thegetElementById()method. - Then, we are creating another variable named
ctx, that uses thegetContext()method to return the drawing context of the canvas, which is2d.
Creating a chart
Now, we're going to create a chart with some colors and a few cool options that will be useful later.
var myChart = new Chart(ctx, {
  type: 'bar',
  data: {
    datasets: [{
      label: '',
      backgroundColor: [
        'rgba(255, 99, 132, 0.2)',
        'rgba(54, 162, 235, 0.2)',
        'rgba(255, 206, 86, 0.2)',
        'rgba(75, 192, 192, 0.2)',
        'rgba(153, 102, 255, 0.2)',
        'rgba(255, 159, 64, 0.2)'
      ],
      borderColor: [
        'rgba(255, 99, 132, 1)',
        'rgba(54, 162, 235, 1)',
        'rgba(255, 206, 86, 1)',
        'rgba(75, 192, 192, 1)',
        'rgba(153, 102, 255, 1)',
        'rgba(255, 159, 64, 1)'
      ],
      borderWidth: 1
    }]
  },

  options: {
    scales: {
      yAxes: [{
        ticks: {
          beginAtZero: true
        }
      }]
    }
  }
});
Let's break this down:
- In a variable called
chart, we are creating a newChartobject. - This object has 2 essential elements: the
typeelement, which specifies what type of chart we want to be rendered, and thedataelement, which contains a series of datasets and labels that will be used to render the chart. - The
backgroundColor:andborderColor:elements set the background and border color for each bar respectively using rgba colors. - The
borderWidthelement sets the width for the border. - The
optionselement is used to configure the chart in different ways.
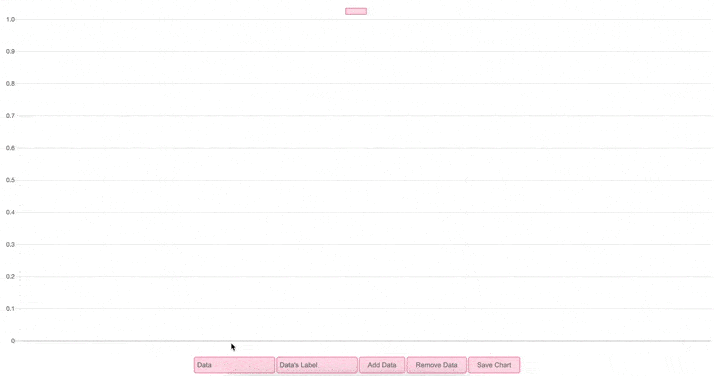
Here's what the code above will render:
Types of charts
Chart.js allows us to use up to 7 built-in charts types, and you can even create your own chart type.
Here are some of them:
Bar
Line
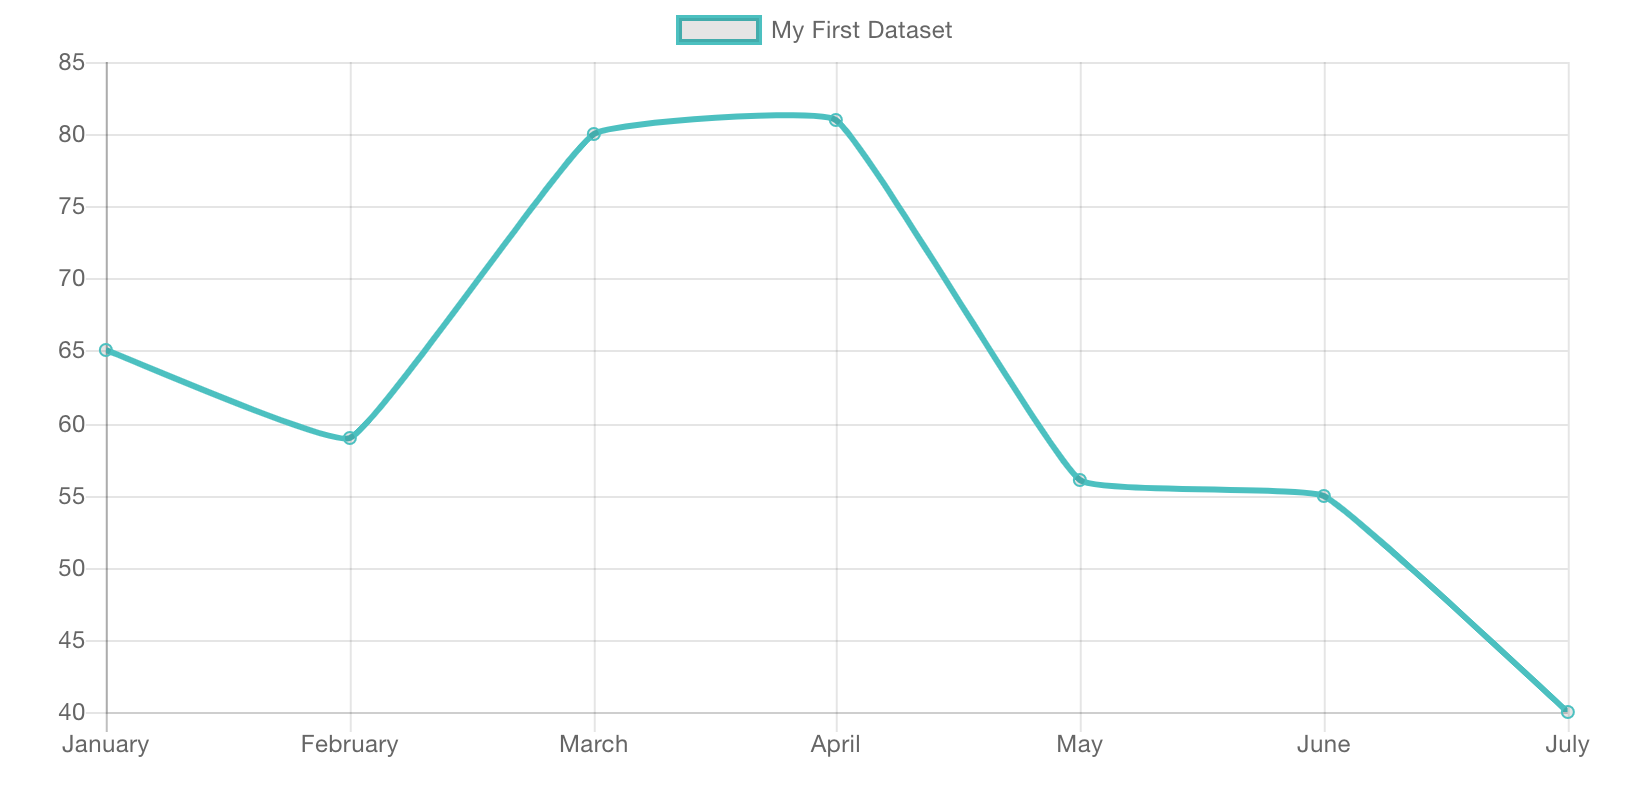
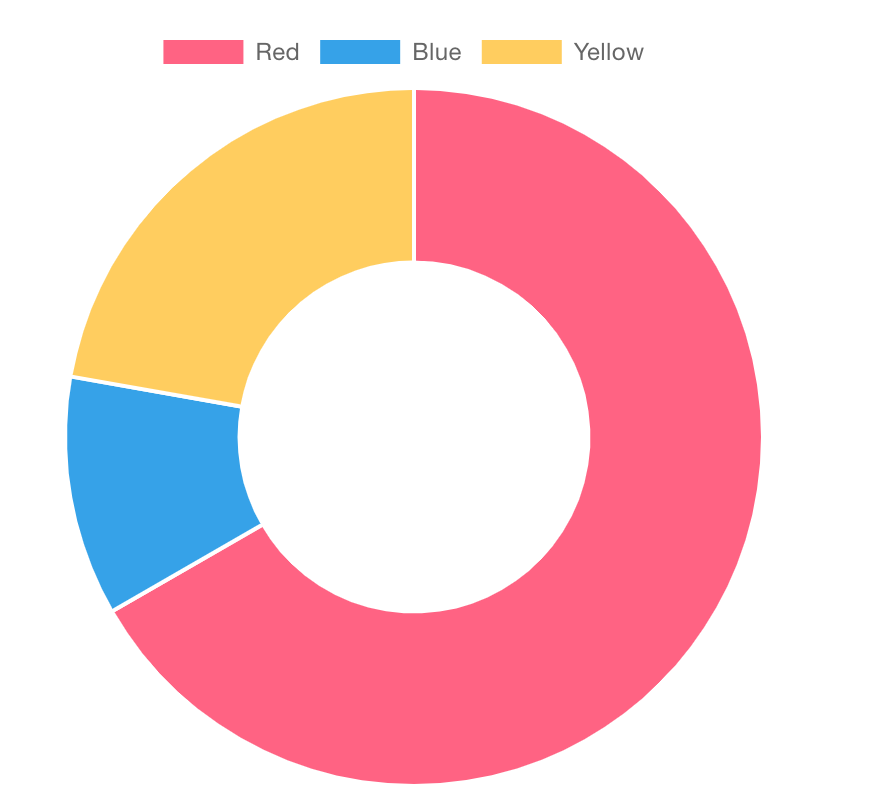
Doughnut and Pie
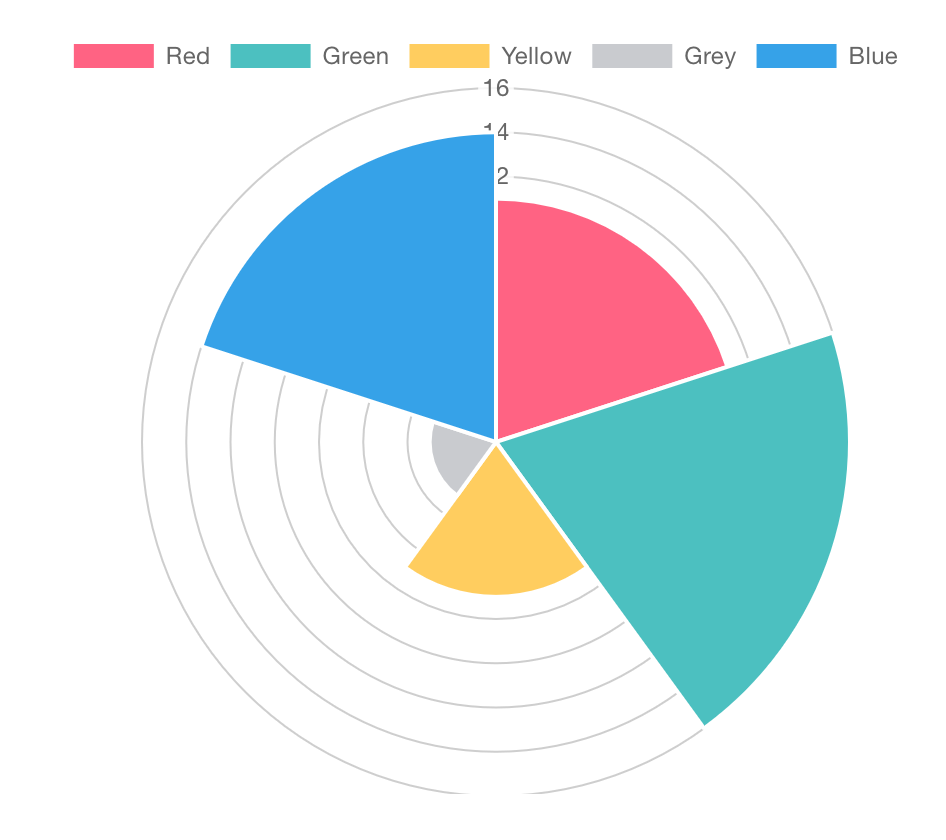
Polar area
Data
Now we have our chart, but we need to get data from somewhere. So, we're going to create a function that takes the input elements and gets their values. Then, using Chart.js methods, we'll push that data into our chart.
function addData(chart) {
  chart.data.labels.push(document.getElementById("label").value);
  chart.data.datasets.forEach((dataset) => {
    dataset.data.push(document.getElementById("data").value);
  });
  chart.update();
}
- We are creating a function called
addData. This function will be called whenever the user clicks on the Add Data button. - Then we are taking the variable
chart(where the Chart object is in), and using its methods:- The
datamethod gets the data array from the objectchart. - The
labelsmethod gets thelabelsarray from thedataarray. - The
pushmethod adds data to thelabelsarray. This data is gotten using the methodsdocument.getElementById()andvalue.
- The
- Then we do the same thing, but this time we'll get the
datasetsarray from thedataarray, and using theforEach()method we'll call a function that will execute for everydatasetin ourdatasetsarray. - Finally, we use the
updatemethod to update the chart once the data is gotten.
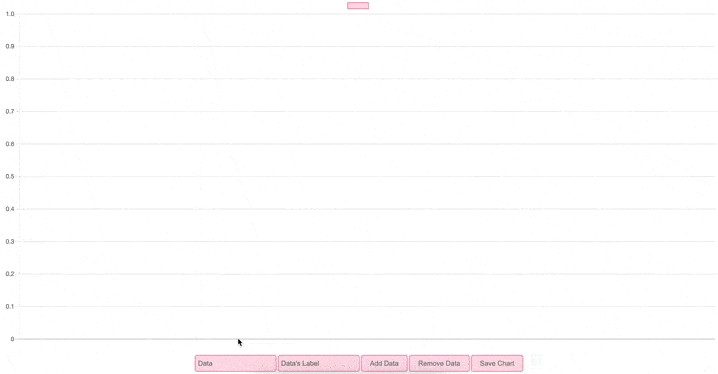
Here's the result of the code above:
Now, we'll create a function that removes data from the chart. We'll do it the same way as the past function, but this time we'll use the pop method instead of the push method.
function removeData(chart) {
  chart.data.labels.pop();
  chart.data.datasets.forEach((dataset) => {
    dataset.data.pop();
  });
  chart.update();
}
Let's see if it works:
Nice! – Now, the last thing we have to do is to create a function that saves the chart as a png image.
function saveCanvas() {
  var image = canvas.toDataURL();
  var tmpLink = document.createElement('a');
  tmpLink.download = 'my_chart.png';
  tmpLink.href = image;
  document.body.appendChild(tmpLink);
  tmpLink.click();
  document.body.removeChild(tmpLink);
}
This is what the code above does:
- Convert the canvas to a data url, and store that url in the variable image.
- Create an HTML link element using the method
document.createElement() - Set the
downloadattribute of thelinkelement tomy_chart.png. This is what the downloaded file gets saved as. - Set the
hrefattribute of thelinkelement to the data url acquired in step 1. This will cause that to be the image that is downloaded when the link is clicked. - Append the link to the end of the page, so that it is part of the website
- Automatically trigger a click event on the link with JavaScript
- Remove the link from the website, so it's no longer visible
Now, let's try it:
Hack it
Yay! You made it to the end of the workshop!

Now that you know how to use Chart.js, feel free to hack it and use it for your personal projects.
Live demos
Check out these charts made by other people using ChartJs:
- Pie chart generator
- Line chart generator with custom animation
- Fetching data from an external API and representing it with Chart Js