

Fractals. You've seen them. They're beautiful:
What kind of crazy black magic lets computers draw these things?? It must be like… really complicated.
WRONG. Fractal renderers are ridiculously simple—and to prove it, you're going to write one.
You should start with this simple HTML document:
<!DOCTYPE html>
<html>
  <head>
    <title>Julia Fractals</title>
  </head>

  <style>
    body {
      background: black;
      color: white;
    }
    canvas {
      border: 1px solid white;
    }
  </style>

  <body>
    <h2></h2>
    <canvas></canvas>
  </body>

  <!-- Import math.js -->
  <script src="https://cdnjs.cloudflare.com/ajax/libs/mathjs/5.6.0/math.min.js"></script>

  <script>
    // The HTML elements we are using
    var header = document.querySelector('h2')
    var canvas = document.querySelector('canvas')
    var ctx = canvas.getContext('2d')

    // The size of our canvas
    var width = 200
    var height = 200

    // Set the size of our canvas
    canvas.width = width
    canvas.height = height

    // The XY coordinates of the mouse over the canvas
    var mouseX = 0
    var mouseY = 0
  </script>
</html>
The Complex Plane
Fractals arise from basic arithmetic with complex numbers. Despite their name, complex numbers are actually quite simple; instead of a number line, complex numbers exist on a plane.
Complex numbers are usually written x+y*i. So 2+4i is at the point (2, 4).
i is the square root of -1 (so i*i=-1). We can't find a value for i on the "real" number line, because x*x is never negative.
For a long time, mathematicians just ignored square roots of negative numbers—just like they used to ignore negative numbers. They aren't "real" numbers, so what good are they?
Then somebody thought to put i on its own separate, vertical number line. The Complex Plane was born—you won't believe what happened next.
From Pixels to Points
Each pixel on our canvas corresponds to a point on the complex plane. We need a function to convert XY pixels to complex points.
Complex numbers aren't "built in" for most programming languages. We'll use a library called math.js to work with them in JavaScript. To create a new complex number with math.js, we simply write math.complex(x, y)
Add a function called pixelToPoint to the end of your script:
// the rest of your script...

// Turn XY pixel coordinates into a point on the complex plane
function pixelToPoint(x, y) {
  // Map percentage of total width/height to a value from -1 to +1
  var zx = (x / width) * 2 - 1
  var zy = 1 - (y / height) * 2

  // Create a complex number based on our new XY values
  return math.complex(zx, zy)
}
This takes the X and Y coordinates for a pixel, divides each to get that pixel's percentage of the overall width/height, and maps that percentage to a value from -1 to +1. The result is a point between -1-1i and 1+1i.
Note how zx is (x/width)*2-1, but zy is 1-(y/height)*2. zy is flipped—this is just because on a webpage, pixel coordinates go top-to-bottom (and we want our complex plane to be bottom-to-top).
Now let's use that function to pick out a point on the plane with the mouse. Later on we'll need a point called constant for our fractal equation, so let's use that.
Add a complex number called constant to the top of your script, just before pixelToPoint and just after mouseX/mouseY:
// mouseX/mouseY + the rest of your script...

// The point we use for C in our Julia Set equation
var constant = math.complex(0.28, 0.01)

// pixelToPoint + the rest of your script...
Now let's hook up the mouse to the canvas.
Add two new functions called update and move to the end of your script. move will fire every time the mouse moves to a new point on the canvas, and update will change the header to show that point.
We'll also add an event listener to the canvas to trigger move:
// pixelToPoint + the rest of your script...

// Update the elements that need to change
function update() {
  header.innerHTML = constant.toString()
}

// What to do when the mouse moves over the canvas
function move(event) {
  // Get the mouse's XY coordinates on canvas
  mouseX = event.clientX - canvas.offsetLeft
  mouseY = event.clientY - canvas.offsetTop

  // Turn mouse coordinates into a point on the complex plane
  constant = pixelToPoint(mouseX, mouseY)

  // Round that point off to the nearest 0.01
  constant.re = math.round(constant.re * 100) / 100
  constant.im = math.round(constant.im * 100) / 100

  // Update everything!
  update()
}

// Trigger move every time the mouse moves over canvas
canvas.addEventListener('pointermove', move)
Note that we're rounding constant to the nearest 0.01:
constant.re = math.round(constant.re * 100) / 100
constant.im = math.round(constant.im * 100) / 100
This just looks a little neater. constant.re is the "real" part of the number—the X value. constant.im is the "imaginary" part—the Y value.
Now if you run the page and mouse over the canvas, you should see constant updating in the header!
Your whole script should look like this:
<script>
  // The HTML elements we are using
  var header = document.querySelector('h2')
  var canvas = document.querySelector('canvas')
  var ctx = canvas.getContext('2d')

  // The size of our canvas
  var width = 200
  var height = 200

  // Set the size of our canvas
  canvas.width = width
  canvas.height = height

  // The XY coordinates of the mouse over the canvas
  var mouseX = 0
  var mouseY = 0

  // The point we use for C in our Julia Set equation
  var constant = math.complex(0.28, 0.01)

  // Turn XY pixel coordinates into a point on the complex plane
  function pixelToPoint(x, y) {
    // Map percentage of total width/height to a value from -1 to +1
    var zx = (x / width) * 2 - 1
    var zy = 1 - (y / height) * 2

    // Create a complex number based on our new XY values
    return math.complex(zx, zy)
  }

  // Update the elements that need to change
  function update() {
    header.innerHTML = constant.toString()
  }

  // What to do when the mouse moves over the canvas
  function move(event) {
    // Get the mouse's XY coordinates on canvas
    mouseX = event.clientX - canvas.offsetLeft
    mouseY = event.clientY - canvas.offsetTop

    // Turn mouse coordinates into a point on the complex plane
    constant = pixelToPoint(mouseX, mouseY)

    // Round that point off to the nearest 0.01
    constant.re = math.round(constant.re * 100) / 100
    constant.im = math.round(constant.im * 100) / 100

    // Update everything!
    update()
  }

  // Trigger move every time the mouse moves over canvas
  canvas.addEventListener('pointermove', move)
</script>
Drawing Pixels
Let's draw some colors on our canvas. Every pixel maps to a point, and every point maps to a color.
Let's make it so that every time we change constant we draw in a color for that pixel.
To do this, we need a new function called pointToColor. This function will turn any point into an RGB color, simply by using the "real" (X) value point.re for Red and the "imaginary" (Y) value point.im for green:
// constant + the rest of your script...

// Turn a point on the complex plane into a color
function pointToColor(point) {
  var red = point.re * 255
  var green = point.im * 255
  return `rgb(${red}, ${green}, 0)`
}

// pixelToPoint + the rest of your script...
We will also need two more functions, called drawPixel and draw.
drawPixel will draw a given color at a given pixel. draw will
// pixelToPoint + the rest of your script...

// Draw a single pixel on our canvas
function drawPixel(x, y, color) {
  ctx.fillStyle = color
  ctx.fillRect(x, y, 1, 1)
}

// Redraw our canvas
function draw() {
  // Turn the point under the mouse into a color
  var color = pointToColor(constant)

  // Draw over the pixel under the mouse with that color
  drawPixel(mouseX, mouseY, color)
}

// update + the rest of your script...
Let's quickly look at drawPixel. This is how basic drawing works with canvas.
First you set properties like fillStyle on the "drawing context" (usually labelled ctx). Then you trigger a drawing operation like fillRect to draw shapes onto the canvas—in this case, a single 1x1 rectangle.
Finally, we need to add draw() to update so that our canvas will redraw anytime we call update:
// draw + the rest of your script...

// Update the elements that need to change
function update() {
  header.innerHTML = constant.toString()
  draw()
}

// move + the rest of your script...
Now if you run the page, you should see little colored pixels show up as you mouse over the plane:
![]()
Your script should now look like this:
<script>
  // The HTML elements we are using
  var header = document.querySelector('h2')
  var canvas = document.querySelector('canvas')
  var ctx = canvas.getContext('2d')

  // The size of our canvas
  var width = 200
  var height = 200

  // Set the size of our canvas
  canvas.width = width
  canvas.height = height

  // The XY coordinates of the mouse over the canvas
  var mouseX = 0
  var mouseY = 0

  // The point we use for C in our Julia Set equation
  var constant = math.complex(0.28, 0.01)

  // Turn a point on the complex plane into a color
  function pointToColor(point) {
    var red = point.re * 255
    var green = point.im * 255
    return `rgb(${red}, ${green}, 0)`
  }

  // Turn XY pixel coordinates into a point on the complex plane
  function pixelToPoint(x, y) {
    // Map percentage of total width/height to a value from -1 to +1
    var zx = (x / width) * 2 - 1
    var zy = 1 - (y / height) * 2

    // Create a complex number based on our new XY values
    return math.complex(zx, zy)
  }

  // Draw a single pixel on our canvas
  function drawPixel(x, y, color) {
    ctx.fillStyle = color
    ctx.fillRect(x, y, 1, 1)
  }

  // Redraw our canvas
  function draw() {
    // Turn the point under the mouse into a color
    var color = pointToColor(constant)

    // Draw over the pixel under the mouse with that color
    drawPixel(mouseX, mouseY, color)
  }

  // Update the elements that need to change
  function update() {
    header.innerHTML = constant.toString()
    draw()
  }

  // What to do when the mouse moves over the canvas
  function move(event) {
    // Get the mouse's XY coordinates on canvas
    mouseX = event.clientX - canvas.offsetLeft
    mouseY = event.clientY - canvas.offsetTop

    // Turn mouse coordinates into a point on the complex plane
    constant = pixelToPoint(mouseX, mouseY)

    // Round that point off to the nearest 0.01
    constant.re = math.round(constant.re * 100) / 100
    constant.im = math.round(constant.im * 100) / 100

    // Update everything!
    update()
  }

  // Trigger move every time the mouse moves over canvas
  canvas.addEventListener('pointermove', move)
</script>
Drawing the Plane
We don't just want to draw one pixel at a time—we want the whole plane at once.
Let's modify our draw function so it fills in every pixel:
// drawPixel + the rest of your script

// Redraw our canvas
function draw() {
  // Loop over every column of pixels
  for (var y = 0; y < height; y++) {
    // Loop over every row of pixels
    for (var x = 0; x < width; x++) {
      // Turn this pixel into a point in the complex plane
      var point = pixelToPoint(x, y)

      // Turn that point into a color
      var color = pointToColor(point)

      // Draw over this pixel with that color
      drawPixel(x, y, color)
    }
  }
}

// update + the rest of your script...
This new draw function is actually pretty simple. It uses two loops—one for X and one for Y—to go over every pixel in our canvas. Then it gets the complex plane point for that pixel. Then it gets the color for that point. Then it draws that color at that pixel.
If you run the page, you should see the same field of red/green pixels—only now they are all filled in!
![]()
The only problem is that the page waits for the mouse to move before drawing the canvas. Let's fix that with a call to update at the end of our script, just after we add the event listener:
// addEventListener + the rest of your script...

// Update everything!
update()
Simple Complex Arithmetic
Let's make a few more changes to our pointToColor function, just to understand what's going on. First, try adding
point = point.sub(constant)
To the top of pointToColor:
// constant + the rest of your script...

// Turn a point on the complex plane into a color
function pointToColor(point) {
  point = point.sub(constant)

  var red = point.re * 255
  var green = point.im * 255

  return `rgb(${red}, ${green}, 0)`
}

// pixelToPoint + the rest of your script...
This means we subtract constant from our point before we turn it into a color. Since complex numbers aren't built into JavaScript, we can't use +-*/—math.js has us use .add() .sub() .mul() .div() instead.
What does it mean to add/subtract a complex number? Well, it's pretty much the same as adding regular numbers: 1+2i + 1+2i = 2+4i.
However, there is a better, more geometric way to think about this: we are using one point to move another point around the plane:
And if you run the page, this is exactly what you should see—when we subtract the mouse position from each point before turning it into a color, the entire plane will move with the mouse:
What a convenient geometric representation!
As it turns out, you can multiply complex numbers too. Amazingly, this also has a simple geometric interpretation: rotation and scaling:
Try changing this line:
point = point.sub(constant)
to this:
point = point.div(constant)
This will divide each point on the plane by constant before turning it into a color. And if you run the page, you should see the plane rotate and scale with the mouse:
This way of thinking about complex numbers—where add/subtract moves a point, and multiply/divide rotates and scales it—is incredibly powerful.
Let's make one more change, to show off an important function called math.abs. The Absolute Value of a complex number is its "length"—the distance from that point on the complex plane to 0+0i.
Try changing your pointToColor function like so:
// constant + the rest of your script...

// Turn a point on the complex plane into a color
function pointToColor(point) {
  point = point.div(constant)

  var red = point.re * 255
  var green = point.im * 255
  var blue = math.abs(point) * 255

  return `rgb(${red}, ${green}, ${blue})`
}

// pixelToPoint + the rest of your script...
Now we have a blue value for our color, which shows math.abs(point). If you run the page, it should look like this:
Think about the colors you see—why these colors? Why is the blue in a circle? Why is one corner white?
Your script should now look like this:
<script>
  // The HTML elements we are using
  var header = document.querySelector('h2')
  var canvas = document.querySelector('canvas')
  var ctx = canvas.getContext('2d')

  // The size of our canvas
  var width = 200
  var height = 200

  // Set the size of our canvas
  canvas.width = width
  canvas.height = height

  // The XY coordinates of the mouse over the canvas
  var mouseX = 0
  var mouseY = 0

  // The point we use for C in our Julia Set equation
  var constant = math.complex(0.28, 0.01)

  // Turn a point on the complex plane into a color
  function pointToColor(point) {
    point = point.sub(constant)

    var red = point.re * 255
    var green = point.im * 255
    var blue = math.abs(point) * 255

    return `rgb(${red}, ${green}, ${blue})`
  }

  // Turn XY pixel coordinates into a point on the complex plane
  function pixelToPoint(x, y) {
    // Map percentage of total width/height to a value from -1 to +1
    var zx = (x / width) * 2 - 1
    var zy = 1 - (y / height) * 2

    // Create a complex number based on our new XY values
    return math.complex(zx, zy)
  }

  // Draw a single pixel on our canvas
  function drawPixel(x, y, color) {
    ctx.fillStyle = color
    ctx.fillRect(x, y, 1, 1)
  }

  // Redraw our canvas
  function draw() {
    // Loop over every column of pixels
    for (var y = 0; y < height; y++) {
      // Loop over every row of pixels
      for (var x = 0; x < width; x++) {
        // Turn this pixel into a point in the complex plane
        var point = pixelToPoint(x, y)

        // Turn that point into a color
        var color = pointToColor(point)

        // Draw over this pixel with that color
        drawPixel(x, y, color)
      }
    }
  }

  // Update the elements that need to change
  function update() {
    header.innerHTML = constant.toString()
    draw()
  }

  // What to do when the mouse moves over the canvas
  function move(event) {
    // Get the mouse's XY coordinates on canvas
    mouseX = event.clientX - canvas.offsetLeft
    mouseY = event.clientY - canvas.offsetTop

    // Turn mouse coordinates into a point on the complex plane
    constant = pixelToPoint(mouseX, mouseY)

    // Round that point off to the nearest 0.01
    constant.re = math.round(constant.re * 100) / 100
    constant.im = math.round(constant.im * 100) / 100

    // Update everything!
    update()
  }

  // Trigger move every time the mouse moves over canvas
  canvas.addEventListener('pointermove', move)

  // Update everything!
  update()
</script>
The Julia Set
Now for the main event—rendering a fractal.
We're going to render the Julia Set. This fractal is defined by a very simple function:
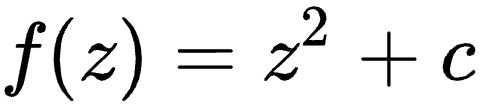
We need to use this equation to generate a color for each point on the complex plane. However, this function doesn't give you a color directly—it defines a process that you can apply to each point:
- Multiply that point by itself
- Add your
constantvalue C - Repeat
- Multiply this new point by itself
- Add your
constantvalue C - Repeat
- Multiply this new point by itself
- Add your
constantvalue C - Repeat…
You can apply this process infinitely for any point. For most points, the number will just keep getting bigger and bigger and bigger. When this happens, we say the number Escapes.
Any point with an absolute value of at least 2 will always get bigger and bigger forever. So if math.abs(z) >= 2, we know that z escapes.
But for some numbers in that little circle around the origin—where math.abs(z) < 2—something peculiar happens. Each time we apply this process, the point will move… but it will never escape. It may just bounce around forever, rotating and moving around the origin without ever "escaping" it.
To get a color from each point, we apply this process a bunch of times to see if that point escapes. We stop when math.abs(z) > 2, or when we hit some maximum number of iterations (we'll set a max of 64).
Add a new value called maxIterations just below constant, and a new function called julia just after that:
// constant + the rest of your script...

// The maximum number of times we iterate a point to see if it escapes
var maxIterations = 64

// Apply the Julia Set formula to see if point z "escapes"
function julia(z, i = 0) {
  // Apply the Julia Set formula: z*z+constant
  z = z.mul(z)
  z = z.add(constant)

  // Has our point escaped, or hit the iteration limit?
  if (math.abs(z) > 2 || i == maxIterations)
    // If so, return number of iterations
    return i
  // If not, iterate again!
  else return julia(z, i + 1)
}

// pointToColor + the rest of your script...
Now we have a function julia which tells us how many iterations of the Julia Set equation it takes for a given point to escape.
We need to turn that number of iterations into a color. We'll use a simple grayscale color scheme, where black is 0 iterations and white is our maxIterations value.
Change your pointToColor function like so:
// julia + the rest of your script...

// Turn a point on the complex plane into a color
function pointToColor(point) {
  // How many iterations on this point before it escapes?
  var iterations = julia(point)

  // What percentage of our limit is that?
  var percentage = iterations / maxIterations

  var red = percentage * 255
  var green = percentage * 255
  var blue = percentage * 255

  // Create a color from that percentage
  return `rgb(${red}, ${green}, ${blue})`
}

// pixelToPoint + the rest of your script...
Now if your run your page, you should see a grayscale Julia fractal that morphs as your move the mouse:
Your whole script should now look like this:
<script>
  // The HTML elements we are using
  var header = document.querySelector('h2')
  var canvas = document.querySelector('canvas')
  var ctx = canvas.getContext('2d')

  // The size of our canvas
  var width = 200
  var height = 200

  // Set the size of our canvas
  canvas.width = width
  canvas.height = height

  // The XY coordinates of the mouse over the canvas
  var mouseX = 0
  var mouseY = 0

  // The point we use for C in our Julia Set equation
  var constant = math.complex(0.28, 0.01)

  // The maximum number of times we iterate a point to see if it escapes
  var maxIterations = 64

  // Apply the Julia Set formula to see if point z "escapes"
  function julia(z, i = 0) {
    // Apply the Julia Set formula: z*z+constant
    z = z.mul(z)
    z = z.add(constant)

    // Has our point escaped, or hit the iteration limit?
    if (math.abs(z) > 2 || i == maxIterations)
      // If so, return number of iterations
      return i
    // If not, iterate again!
    else return julia(z, i + 1)
  }

  // Turn a point on the complex plane into a color
  function pointToColor(point) {
    // How many iterations on this point before it escapes?
    var iterations = julia(point)

    // What percentage of our limit is that?
    var percentage = iterations / maxIterations

    var red = percentage * 255
    var green = percentage * 255
    var blue = percentage * 255

    // Create a color from that percentage
    return `rgb(${red}, ${green}, ${blue})`
  }

  // Turn XY pixel coordinates into a point on the complex plane
  function pixelToPoint(x, y) {
    // Map percentage of total width/height to a value from -1 to +1
    var zx = (x / width) * 2 - 1
    var zy = 1 - (y / height) * 2

    // Create a complex number based on our new XY values
    return math.complex(zx, zy)
  }

  // Draw a single pixel on our canvas
  function drawPixel(x, y, color) {
    ctx.fillStyle = color
    ctx.fillRect(x, y, 1, 1)
  }

  // Redraw our canvas
  function draw() {
    // Loop over every column of pixels
    for (var y = 0; y < height; y++) {
      // Loop over every row of pixels
      for (var x = 0; x < width; x++) {
        // Turn this pixel into a point in the complex plane
        var point = pixelToPoint(x, y)

        // Turn that point into a color
        var color = pointToColor(point)

        // Draw over this pixel with that color
        drawPixel(x, y, color)
      }
    }
  }

  // Update the elements that need to change
  function update() {
    header.innerHTML = constant.toString()
    draw()
  }

  // What to do when the mouse moves over the canvas
  function move(event) {
    // Get the mouse's XY coordinates on canvas
    mouseX = event.clientX - canvas.offsetLeft
    mouseY = event.clientY - canvas.offsetTop

    // Turn mouse coordinates into a point on the complex plane
    constant = pixelToPoint(mouseX, mouseY)

    // Round that point off to the nearest 0.01
    constant.re = math.round(constant.re * 100) / 100
    constant.im = math.round(constant.im * 100) / 100

    // Update everything!
    update()
  }

  // Trigger move every time the mouse moves over canvas
  canvas.addEventListener('pointermove', move)

  // Update everything!
  update()
</script>
Pan
Now we have a fractal, which is pretty cool. But what if we want to move around within our fractal?
Let's start with a "pan" operation, that moves the image up/down/left/right as we click.
We'll set this up so that the first click sets our constant value, and every click after that pans the image.
Add two new values for clicked and pan at the top, just below maxIterations and above julia:
// maxIterations + the rest of your script...

// Whether we have clicked yet
var clicked = false

// How much we move the image
var pan = math.complex(0, 0)

// julia + the rest of your script...
Now add a new function called click, just after update:
// update + the rest of your script...

function click(event) {
  // Ignore the first click
  if (!clicked) {
    clicked = true
    return
  }

  // Get the mouse's XY coordinates on canvas
  mouseX = event.clientX - canvas.offsetLeft
  mouseY = event.clientY - canvas.offsetTop

  // Turn mouse coordinates into a point on the complex plane
  pan = pixelToPoint(mouseX, mouseY)

  // Update everything!
  update()
}

// the rest of your script...
Notice that if clicked is false, click will do nothing—except set clicked to true.
Similarly, we need to change move so that it will do nothing if clicked is true:
// click + the rest of your script...

// What to do when the mouse moves over the canvas
function move(event) {
  // Don't move after first click
  if (clicked) {
    return
  }

  // Get the mouse's XY coordinates on canvas
  mouseX = event.clientX - canvas.offsetLeft
  mouseY = event.clientY - canvas.offsetTop

  // Turn mouse coordinates into a point on the complex plane
  constant = pixelToPoint(mouseX, mouseY)

  // Round that point off to the nearest 0.01
  constant.re = math.round(constant.re * 100) / 100
  constant.im = math.round(constant.im * 100) / 100

  // Update everything!
  update()
}
We also need to add a listener to trigger click whenever we click on the canvas. Let's put it just after our move function:
// move + the rest of your script...

// Trigger click every time the canvas is clicked
canvas.addEventListener('click', click)

// the rest of your script...
Now when we click on the canvas, it will fix our constant value—and every click after that will change the pan value.
Finally, we need to actually use that pan value somewhere.
We want pan to change which pixel maps to each point—so we need to change our pixelToPoint function so that our pan value is added to each point:
// pointToColor + the rest of your script...

// Turn XY pixel coordinates into a point on the complex plane
function pixelToPoint(x, y) {
  // Map percentage of total width/height to a value from -1 to +1
  var zx = (x / width) * 2 - 1
  var zy = 1 - (y / height) * 2

  // Create a complex number based on our new XY values
  var z = math.complex(zx, zy)

  // Pan the camera
  z = z.add(pan)

  return z
}

// drawPixel + the rest of your script...
Now if you run the page, you should be able to set the constant value and pan around the image by clicking!
Your full script should look like this:
<script>
  // The HTML elements we are using
  var header = document.querySelector('h2')
  var canvas = document.querySelector('canvas')
  var ctx = canvas.getContext('2d')

  // The size of our canvas
  var width = 200
  var height = 200

  // Set the size of our canvas
  canvas.width = width
  canvas.height = height

  // The XY coordinates of the mouse over the canvas
  var mouseX = 0
  var mouseY = 0

  // The point we use for C in our Julia Set equation
  var constant = math.complex(0.28, 0.01)

  // The maximum number of times we iterate a point to see if it escapes
  var maxIterations = 64

  // Whether we have clicked yet
  var clicked = false

  // How much we move the image
  var pan = math.complex(0, 0)

  // Apply the Julia Set formula to see if point z "escapes"
  function julia(z, i = 0) {
    // Apply the Julia Set formula: z*z+constant
    z = z.mul(z)
    z = z.add(constant)

    // Has our point escaped, or hit the iteration limit?
    if (math.abs(z) > 2 || i == maxIterations)
      // If so, return number of iterations
      return i
    // If not, iterate again!
    else return julia(z, i + 1)
  }

  // Turn a point on the complex plane into a color
  function pointToColor(point) {
    // How many iterations on this point before it escapes?
    var iterations = julia(point)

    // What percentage of our limit is that?
    var percentage = iterations / maxIterations

    var red = percentage * 255
    var green = percentage * 255
    var blue = percentage * 255

    // Create a color from that percentage
    return `rgb(${red}, ${green}, ${blue})`
  }

  // Turn XY pixel coordinates into a point on the complex plane
  function pixelToPoint(x, y) {
    // Map percentage of total width/height to a value from -1 to +1
    var zx = (x / width) * 2 - 1
    var zy = 1 - (y / height) * 2

    // Create a complex number based on our new XY values
    var z = math.complex(zx, zy)

    // Pan the camera
    z = z.add(pan)

    return z
  }

  // Draw a single pixel on our canvas
  function drawPixel(x, y, color) {
    ctx.fillStyle = color
    ctx.fillRect(x, y, 1, 1)
  }

  // Redraw our canvas
  function draw() {
    // Loop over every column of pixels
    for (var y = 0; y < height; y++) {
      // Loop over every row of pixels
      for (var x = 0; x < width; x++) {
        // Turn this pixel into a point in the complex plane
        var point = pixelToPoint(x, y)

        // Turn that point into a color
        var color = pointToColor(point)

        // Draw over this pixel with that color
        drawPixel(x, y, color)
      }
    }
  }

  // Update the elements that need to change
  function update() {
    header.innerHTML = constant.toString()
    draw()
  }

  function click(event) {
    // Ignore the first click
    if (!clicked) {
      clicked = true
      return
    }

    // Get the mouse's XY coordinates on canvas
    mouseX = event.clientX - canvas.offsetLeft
    mouseY = event.clientY - canvas.offsetTop

    // Turn mouse coordinates into a point on the complex plane
    pan = pixelToPoint(mouseX, mouseY)

    // Update everything!
    update()
  }

  // What to do when the mouse moves over the canvas
  function move(event) {
    // Don't move after first click
    if (clicked) {
      return
    }

    // Get the mouse's XY coordinates on canvas
    mouseX = event.clientX - canvas.offsetLeft
    mouseY = event.clientY - canvas.offsetTop

    // Turn mouse coordinates into a point on the complex plane
    constant = pixelToPoint(mouseX, mouseY)

    // Round that point off to the nearest 0.01
    constant.re = math.round(constant.re * 100) / 100
    constant.im = math.round(constant.im * 100) / 100

    // Update everything!
    update()
  }

  // Trigger click every time the canvas is clicked
  canvas.addEventListener('click', click)

  // Trigger move every time the mouse moves over canvas
  canvas.addEventListener('pointermove', move)

  // Update everything!
  update()
</script>
Zoom
Almost done here… all we need now is a zoom feature.
Add a new variable for zoom, just after pan:
// pan + the rest of your script...

// How much we zoom the image
var zoom = 1

// julia + the rest of your script...
Let's make it so every click doubles the zoom value.
We just need to add one new line to our click function for zoom *= 2:
// update + the rest of your script...

// What to do when the mouse clicks the canvas
function click(event) {
  // Ignore the first click
  if (!clicked) {
    clicked = true
    return
  }

  // Get the mouse's XY coordinates on canvas
  mouseX = event.clientX - canvas.offsetLeft
  mouseY = event.clientY - canvas.offsetTop

  // Turn mouse coordinates into a point on the complex plane
  pan = pixelToPoint(mouseX, mouseY)

  // Zoom in twice as far
  zoom *= 2

  // Update everything!
  update()
}

// move + the rest of your script...
Now we need to change our pixelToPoint function to use that zoom value. Like pan, this is pretty simple—we just need to divide each point by zoom, just before we add pan:
// pointToColor + the rest of your script...

// Turn XY pixel coordinates into a point on the complex plane
function pixelToPoint(x, y) {
  // Map percentage of total width/height to a value from -1 to +1
  var zx = (x / width) * 2 - 1
  var zy = 1 - (y / height) * 2

  // Create a complex number based on our new XY values
  var z = math.complex(zx, zy)

  // Zoom the camera
  z = z.div(zoom)

  // Pan the camera
  z = z.add(pan)

  return z
}

// drawPixel + the rest of your script...
Finally, let's make one last change to our update function so that it will tell us how far we have zoomed in:
// draw + the rest of your script...

// Update the elements that need to change
function update() {
  header.innerHTML = constant.toString() + ' at ' + zoom + 'X'
  draw()
}

// click + the rest of your script...
Now if you run the page, you should be able to zoom in on the image with every click!
Your final script should look like this:
<script>
  // The HTML elements we are using
  var header = document.querySelector('h2')
  var canvas = document.querySelector('canvas')
  var ctx = canvas.getContext('2d')

  // The size of our canvas
  var width = 200
  var height = 200

  // Set the size of our canvas
  canvas.width = width
  canvas.height = height

  // The XY coordinates of the mouse over the canvas
  var mouseX = 0
  var mouseY = 0

  // The point we use for C in our Julia Set equation
  var constant = math.complex(0.28, 0.01)

  // The maximum number of times we iterate a point to see if it escapes
  var maxIterations = 64

  // Whether we have clicked yet
  var clicked = false

  // How much we move the image
  var pan = math.complex(0, 0)

  // How much we zoom the image
  var zoom = 1

  // Apply the Julia Set formula to see if point z "escapes"
  function julia(z, i = 0) {
    // Apply the Julia Set formula: z*z+constant
    z = z.mul(z)
    z = z.add(constant)

    // Has our point escaped, or hit the iteration limit?
    if (math.abs(z) > 2 || i == maxIterations)
      // If so, return number of iterations
      return i
    // If not, iterate again!
    else return julia(z, i + 1)
  }

  // Turn a point on the complex plane into a color
  function pointToColor(point) {
    // How many iterations on this point before it escapes?
    var iterations = julia(point)

    // What percentage of our limit is that?
    var percentage = iterations / maxIterations

    var red = percentage * 255
    var green = percentage * 255
    var blue = percentage * 255

    // Create a color from that percentage
    return `rgb(${red}, ${green}, ${blue})`
  }

  // Turn XY pixel coordinates into a point on the complex plane
  function pixelToPoint(x, y) {
    // Map percentage of total width/height to a value from -1 to +1
    var zx = (x / width) * 2 - 1
    var zy = 1 - (y / height) * 2

    // Create a complex number based on our new XY values
    var z = math.complex(zx, zy)

    // Zoom the camera
    z = z.div(zoom)

    // Pan the camera
    z = z.add(pan)

    return z
  }

  // Draw a single pixel on our canvas
  function drawPixel(x, y, color) {
    ctx.fillStyle = color
    ctx.fillRect(x, y, 1, 1)
  }

  // Redraw our canvas
  function draw() {
    // Loop over every column of pixels
    for (var y = 0; y < height; y++) {
      // Loop over every row of pixels
      for (var x = 0; x < width; x++) {
        // Turn this pixel into a point in the complex plane
        var point = pixelToPoint(x, y)

        // Turn that point into a color
        var color = pointToColor(point)

        // Draw over this pixel with that color
        drawPixel(x, y, color)
      }
    }
  }

  // Update the elements that need to change
  function update() {
    header.innerHTML = constant.toString() + ' at ' + zoom + 'X'
    draw()
  }

  // What to do when the mouse clicks the canvas
  function click(event) {
    // Ignore the first click
    if (!clicked) {
      clicked = true
      return
    }

    // Get the mouse's XY coordinates on canvas
    mouseX = event.clientX - canvas.offsetLeft
    mouseY = event.clientY - canvas.offsetTop

    // Turn mouse coordinates into a point on the complex plane
    pan = pixelToPoint(mouseX, mouseY)

    // Zoom in twice as far
    zoom *= 2

    // Update everything!
    update()
  }

  // What to do when the mouse moves over the canvas
  function move(event) {
    // Don't move after first click
    if (clicked) {
      return
    }

    // Get the mouse's XY coordinates on canvas
    mouseX = event.clientX - canvas.offsetLeft
    mouseY = event.clientY - canvas.offsetTop

    // Turn mouse coordinates into a point on the complex plane
    constant = pixelToPoint(mouseX, mouseY)

    // Round that point off to the nearest 0.01
    constant.re = math.round(constant.re * 100) / 100
    constant.im = math.round(constant.im * 100) / 100

    // Update everything!
    update()
  }

  // Trigger click every time the canvas is clicked
  canvas.addEventListener('click', click)

  // Trigger move every time the mouse moves over canvas
  canvas.addEventListener('pointermove', move)

  // Update everything!
  update()
</script>
Epilogue
There are all kinds of fractals.
You can make fractal trees:
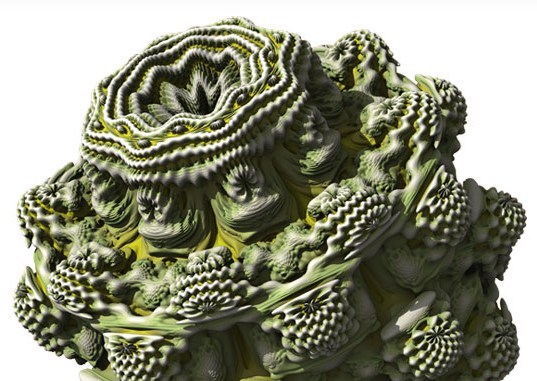
Or how about some 3D fractals:
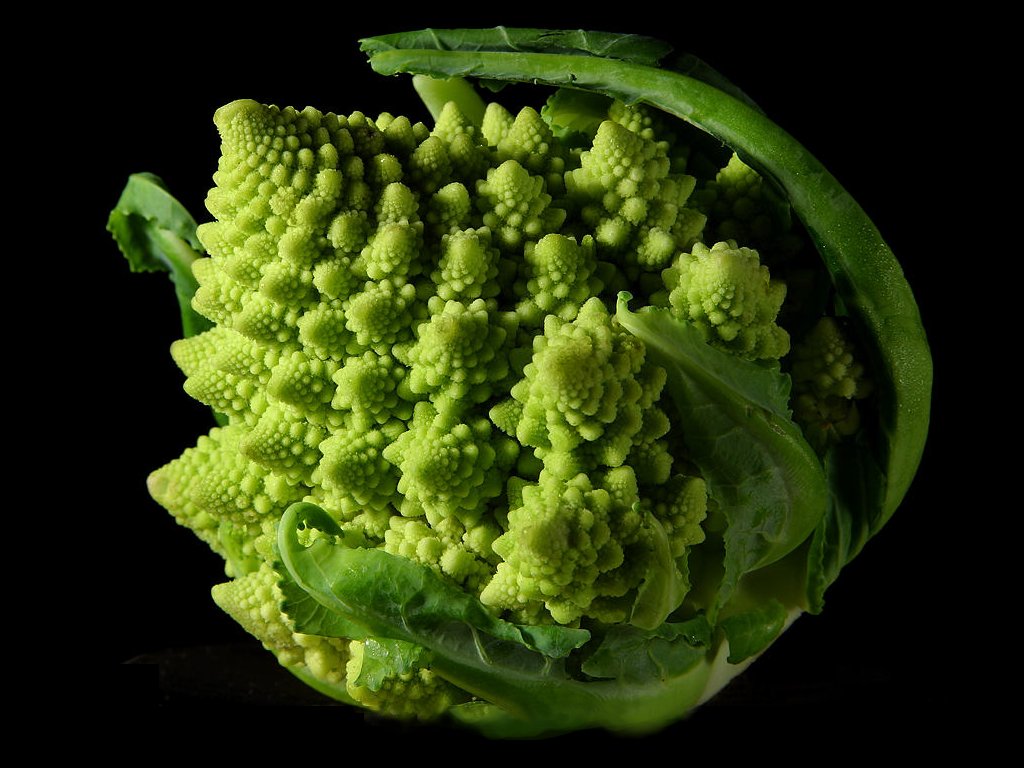
You can even grow broccoli with fractals (yes this is real broccoli that you can buy at some supermarkets):
But fractals are just the beginning of what you can do with complex numbers. Complex numbers are essential to everything from quantum physics to guitar amplifiers.
Pretty remarkable for such a simple idea.
Want to learn more stuff like this? I recommend checking out 3Blue1Brown.
Sources
- Thanks to Simpsons Contributor on Wikimedia for the fractal zoom gif
- Thanks to Rafael Ruggiero for the fractal tree gif
- Thanks to the mandelbulb.com team for the mandelbulb image
- Thanks to Jon Sullivan on Wikimedia for his image of romanesco broccoli