

Today, We'll be creating a simple bubbles map using a popular JavaScript library Leaflet. In fact the React version of it - React-Leaflet.

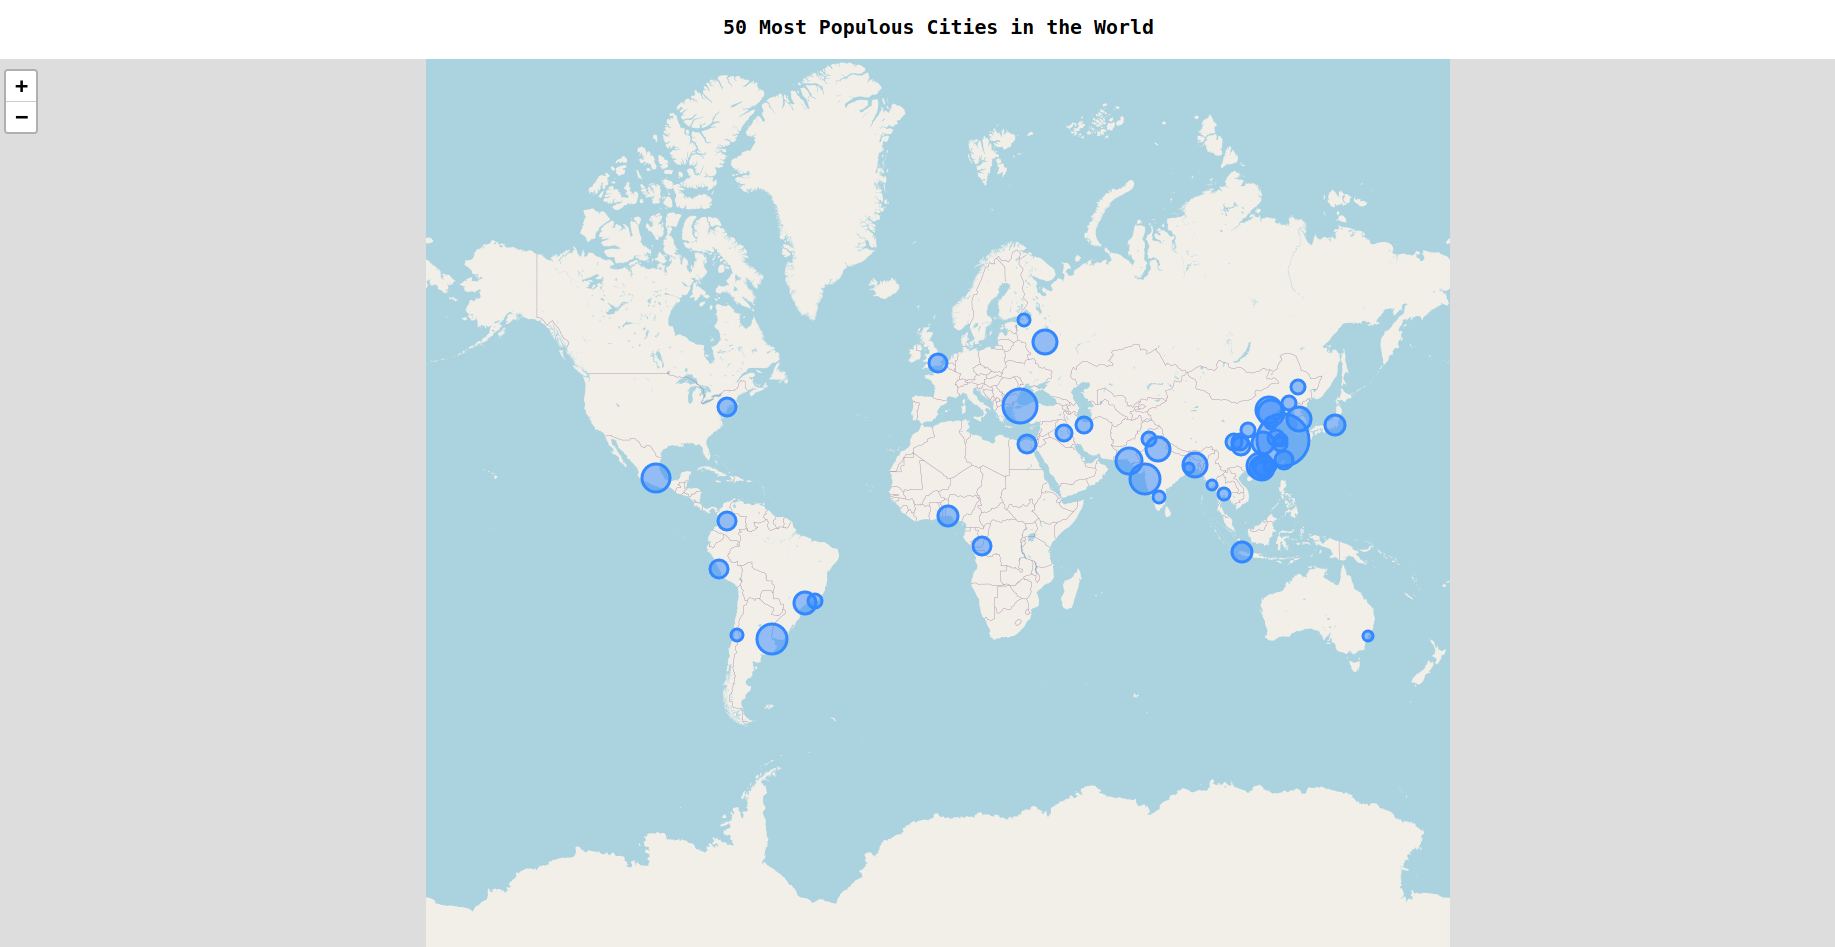
Here's the source code.
Part 1: Prerequisites
You should know the basics of React and I recommend you to follow this workshop before proceeding further. If you're having trouble, feel free to ask me or anyone in the Hack Club Slack!
Part 2: Setup
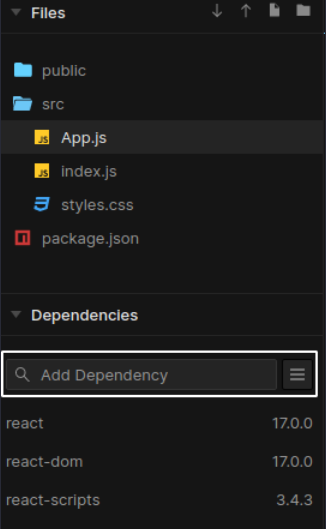
For writing our code, we'll be using CodeSandbox which is the best online code editor for creating React apps.
Go to this starter code. Press ctrl+s / cmd+s and it will automatically fork it for you. Now, we have everything set up so let's get started!
Part 3: Building the project
1) Making a basic map
First, delete the styles.css file from your project as we won't need much CSS in today's workshop and we'll make use of inline styles and also the default CSS which comes with leaflet.
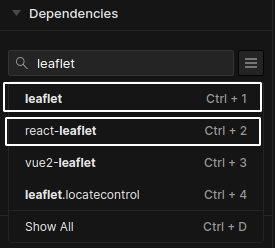
Now let's install the 2 dependencies, namely leaflet and react-leaflet into your project. To do this, simply search for those dependencies in the left column and install it by selecting it.
Let’s edit App.js by removing unnecessary lines of code and importing modules from react-leaflet that we just installed.
import React, { useEffect, useState } from "react";
import { MapContainer, CircleMarker, TileLayer, Tooltip } from "react-leaflet";
import Leaflet from "leaflet";
import "leaflet/dist/leaflet.css";

export default function App() {
  return (
    <div className="App">
      <h3 style={{ textAlign: "center" }}>
        50 Most Populous Cities in the World
      </h3>
    </div>
  );
}
Explanation: We imported useEffect and useState as we'll use it later in the workshop. Next, MapContainer, CircleMarker, TileLayer and Tooltip are the 4 components that we are going to use to plot our map. Similarly, we also import the CSS styles for the map from leaflet.
Next, we use inline styles to align the heading to the center.
Now, let's create a container that will hold our map using leaflet in React!
export default function App() {
  return (
    <div className="App">
      <h3 style={{ textAlign: "center" }}>
        50 Most Populous Cities in the World
      </h3>
      <MapContainer
        center={[0, 0]}
        zoom={2}
        minZoom={1.5}
        style={{ height: "100vh", width: "100%" }}
      ></MapContainer>
    </div>
  );
}
Explanation: the MapContainer component will act as the main container to our map. It requires certain props such as center which we have kept as 0, 0 (latitude and longitude), the default zoom which we have kept as 2, the minimum zoom limit (minZoom) as 1.5 and also the width and height for the map.
Learn more about the MapContainer component.
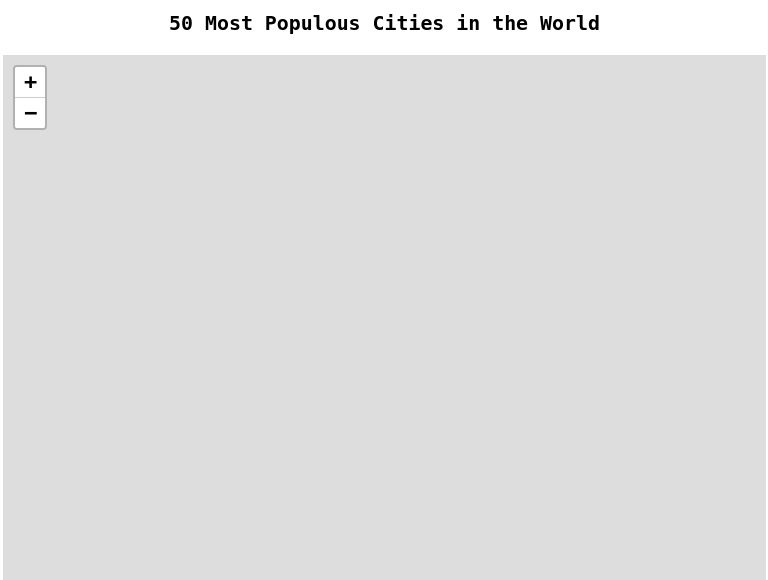
You'll be able to see a basic map container rendered on the browser!
Next we’ll add a TileLayer inside our MapContainer. It is used to load and display tile layers of the map using a specific tile url.
<MapContainer
  center={[0, 0]}
  zoom={2}
  minZoom={1.5}
  style={{ height: "100vh", width: "100%" }}>
  <TileLayer url="http://{s}.tile.openstreetmap.org/{z}/{x}/{y}.png" />
</MapContainer>
Voila! We can see the map of the world rendered on the browser!
Learn more about the TileLayer component.
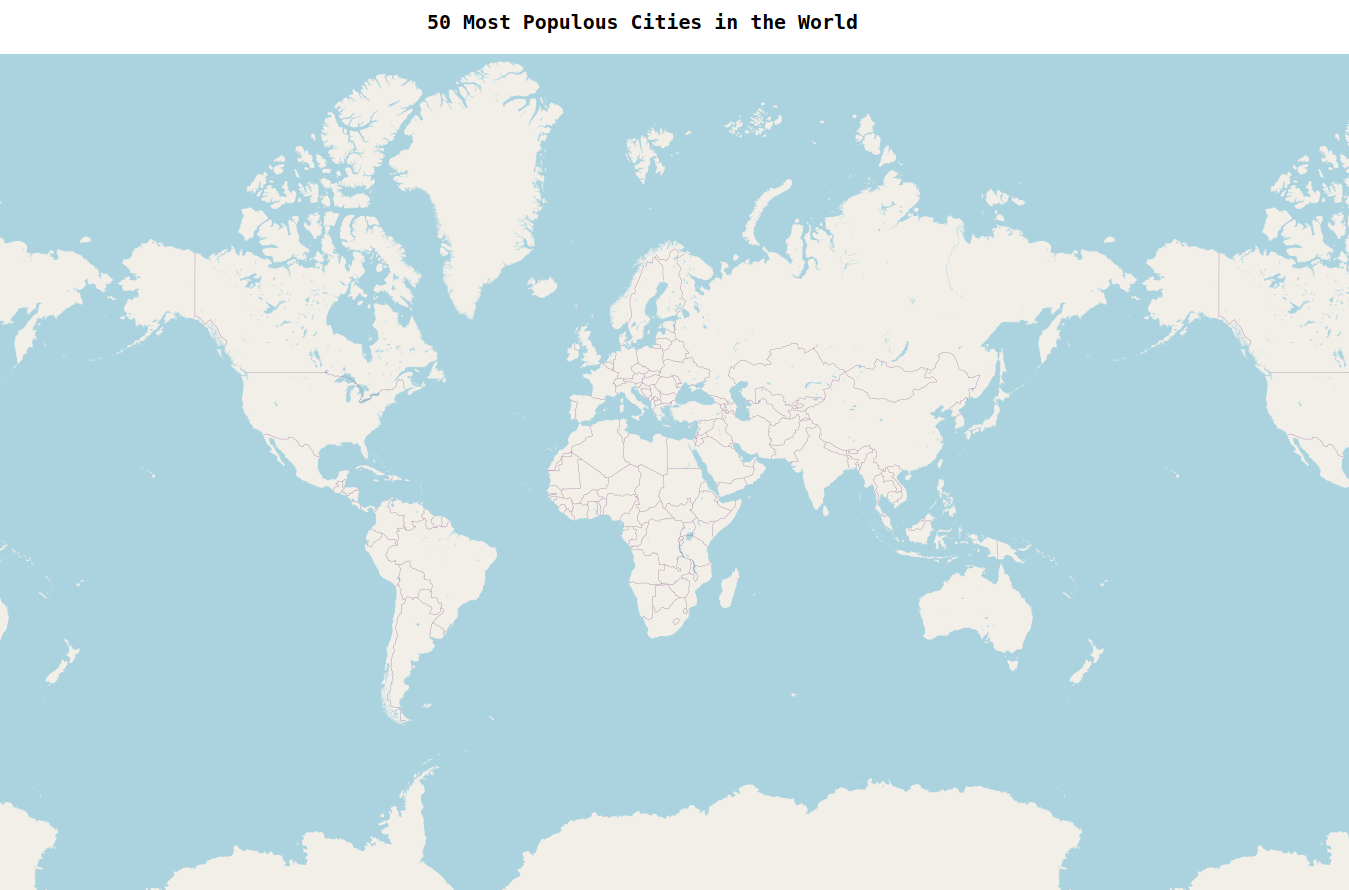
Here, we finish building a very basic map of the world using react-leaflet!
2) Fetching the data
We now need the data of the populous cities and their population (ofcourse!). For this, we'll need to make use of (yeah, you guessed it!) an API endpoint.
For your comfort, I created an API for this using https://public.opendatasoft.com/explore which will return us those 50 cities!
Here's where I built it.
We get the API URL as:
Now, its time to make the API request!
NOTE: If you don't know what an API is or how do we make the requests, I recommend you to follow this simple workshop to get yourself familiar with it!
Let's create a cities state to store our data and as we want our app to make only 1 request to the API, we'll write it inside of the useEffect hook!
const url = "https://public.opendatasoft.com/api/records/1.0/search/?dataset=geonames-all-cities-with-a-population-1000&q=&lang=EN&rows=50&sort=population&facet=timezone&facet=country"

export default function App() {
  const [cities, setCities] = useState();

  useEffect(() => {
    async function fetchCities() {
      try {
        const res = await fetch(url);
        setCities(await res.json());
      } catch (err) {
        console.error(err);
      }
    }

    fetchCities();
  }, []);
Explanation: We create an async function fetchCities inside useEffect which makes an API call to the given url. Then, we store that response in the res variable. Then, after converting it to json format, all that data gets stored in the cities state. We pass the empty dependency array ([]) to useEffect to make sure it only runs once.
Now, we can see our data stored inside the cities state!
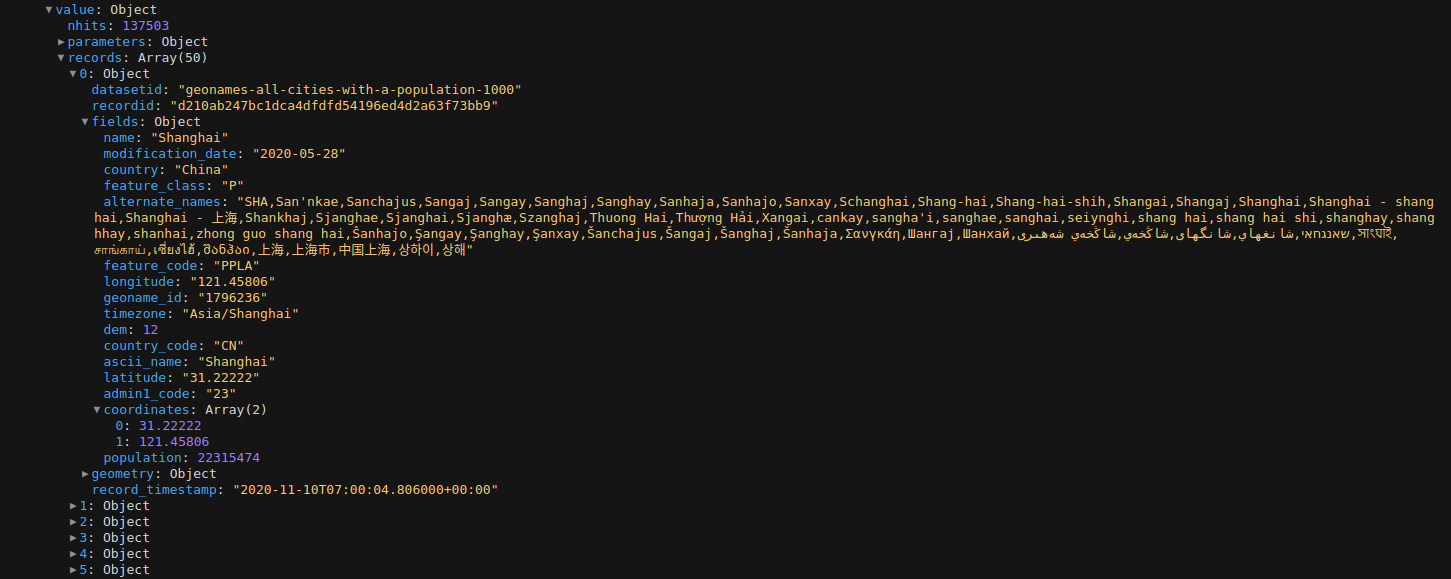
NOTE: This can be seen in the console.
Learn more about useEffect.
Learn more about async-await.
Your code so far:
import React, { useEffect, useState } from "react";
import { MapContainer, CircleMarker, TileLayer, Tooltip } from "react-leaflet";
import Leaflet from "leaflet";
import "leaflet/dist/leaflet.css";

const url = "https://public.opendatasoft.com/api/records/1.0/search/?dataset=geonames-all-cities-with-a-population-1000&q=&lang=EN&rows=50&sort=population&facet=timezone&facet=country"

export default function App() {
  const [cities, setCities] = useState();

  useEffect(() => {
    async function fetchCities() {
      try {
        const res = await fetch(url);
        setCities(await res.json());
      } catch (err) {
        console.error(err);
      }
    }

    fetchCities();
  }, []);

  return (
    <div className="App">
      <h3 style={{ textAlign: "center" }}>
        50 Most Populous Cities in the World
      </h3>
      <MapContainer
        center={[0, 0]}
        zoom={2}
        minZoom={1.5}
        style={{ height: "100vh", width: "100%" }}
      >
        <TileLayer url="http://{s}.tile.openstreetmap.org/{z}/{x}/{y}.png" />
      </MapContainer>
    </div>
  );
}
3) Creating the bubbles
We can now use this data to locate those cities on the map and create bubbles on that location according to their population!
We need such bubbles at the location of each city and for this, we can simply use the JavaScript map() method!
<MapContainer {/* ... */}>
  <TileLayer url="http://{s}.tile.openstreetmap.org/{z}/{x}/{y}.png"/>

  {cities &&
    cities.records.map((city, i) => {
      return (
        <CircleMarker
          center={[
            city.fields["coordinates"][0],
            city.fields["coordinates"][1]
          ]}
          radius={1.5 * (city.fields.population / 1000000)}
          fillOpacity={0.4}
          stroke={true}
          key={city.recordid}>
        </CircleMarker>
      );
    })}
</MapContainer>
Explanation: By using cities && cities.records.map, we first make sure that cities isn't empty by any chance or our whole app might crash! Next, if we take a look into the data, we have an array records containing an object for each city. So, we map the records array.
The map() method calls the provided function once for each element in an array, in order. Each element of that array is referred as a city at each iteration (you can name it anything else too). We also use a variable i to refer the index of an element.
Next, by making the use of the CircleMarker component, we create those bubbles. CircleMarker takes in the props such as:
center- This takes in an array of 2 values mainly the longitude and the latitude of that location.
If we look inside our data, we'll find an array of co-ordinates inside the fields object inside each city record.
-
radius- This takes in the radius of the circle as to how big it must be. -
fillOpacity- The opacity of the bubble (circle). -
stroke- This is a boolean prop which determines whether the circle should have a stroke or not! -
key- Thekeyprop is always necessary while mapping arrays. Also, it should always be a unique value for each element. Each city has a uniquerecordidand we use it as the key of that element.
Learn more about the map() method.
Learn more about the CircleMarker component.
Woah! Woah! Woah! Look what you just built! We have a bubble mapped perfectly for each city and also with a varying size!
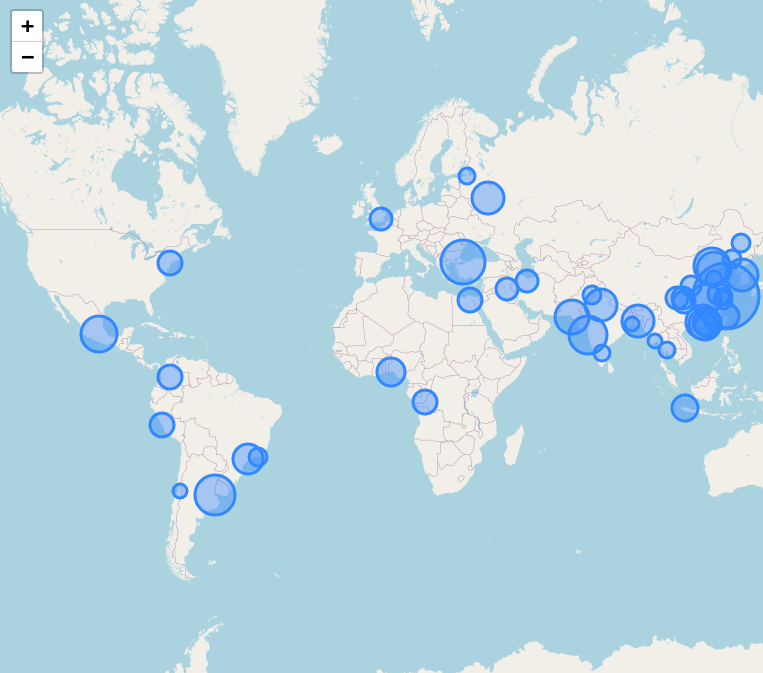
The most populous city has a bigger circle and the less populous cities have a slightly smaller circle and so on!
But wait! We aren't finished here yet! If you checked the demo of this workshop, we were able to hover on the bubble and get the name and population of that particular city!
Let's work on building this functionality which turns out to be much much easier than anything!
Here's where the Tooltip component comes into picture! This component is used inside a CircleMarker component to create a popup for that circle.
{cities &&
  cities.records.map((city, i) => {
    return (
      <CircleMarker
        center={[...]}
        radius={...}
        fillOpacity={0.4}
        stroke={true}
        key={city.recordid}>
        <Tooltip direction="top" offset={[0, -2]} opacity={1}>
          <span>
            {i + 1}. {city.fields.name} : {city.fields.population}
          </span>
        </Tooltip>
      </CircleMarker>
    );
})}
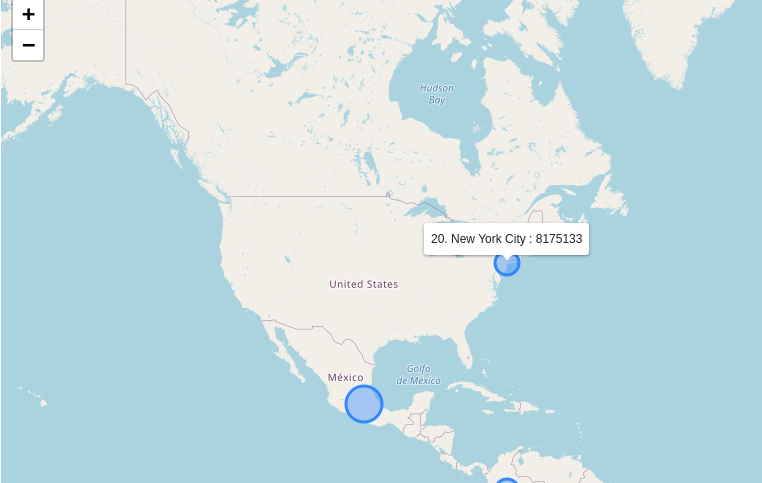
Explanation: For each mapped bubble, a Tooltip component will be created with the direction as top, a y-offset of -2 so it's a bit above the center of the circle and also the opacity set to 1.
A span will be rendered out as the popup which will display the rank of the city using i + 1 (index starts from 0, so we added 1 to it), the name of the city and also the population of it!
Learn more about the Tooltip component.
Annnd we can see the tooltip on hover! Yippee!

We are pretty much done! But before winding up, we need to make some finishing changes to our workshop.
-
You might notice that the map is continuous which feel a bit annoying.
-
There's a bug which lets you drag the map out of the visible browser screen which is not very appealing.
So let's fix all these bugs in the next section!
NOTE: If you feel satisfied with the current state of the project, it's totally upto you and you can skip it. But if you want to learn new stuff, then stick around!
Your code so far:
import React, { useEffect, useState } from "react";
import { MapContainer, CircleMarker, TileLayer, Tooltip } from "react-leaflet";
import Leaflet from "leaflet";
import "leaflet/dist/leaflet.css";

const url =
  "https://public.opendatasoft.com/api/records/1.0/search/?dataset=geonames-all-cities-with-a-population-1000&q=&lang=EN&rows=50&sort=population&facet=timezone&facet=country";

export default function App() {
  const [cities, setCities] = useState();

  useEffect(() => {
    async function fetchCities() {
      try {
        const res = await fetch(url);
        setCities(await res.json());
      } catch (err) {
        console.error(err);
      }
    }

    fetchCities();
  }, []);

  return (
    <div className="App">
      <h3 style={{ textAlign: "center" }}>
        50 Most Populous Cities in the World
      </h3>
      <MapContainer
        center={[0, 0]}
        zoom={2}
        minZoom={1.5}
        style={{ height: "100vh", width: "100%" }}
      >
        <TileLayer url="http://{s}.tile.openstreetmap.org/{z}/{x}/{y}.png" />

        {cities &&
          cities.records.map((city, i) => {
            return (
              <CircleMarker
                center={[
                  city.fields["coordinates"][0],
                  city.fields["coordinates"][1]
                ]}
                radius={1.5 * (city.fields.population / 1000000)}
                fillOpacity={0.4}
                stroke={true}
                key={city.recordid}
              >
                <Tooltip direction="top" offset={[0, -2]} opacity={1}>
                  <span>
                    {i + 1}. {city.fields.name} : {city.fields.population}
                  </span>
                </Tooltip>
              </CircleMarker>
            );
          })}
      </MapContainer>
    </div>
  );
}
4) Making the finishing changes
First, let's remove the continuity of the map. This can be simply done by adding a boolean prop noWrap set to true in the TileLayer component!
<MapContainer {/* ... */}>
  <TileLayer
    url="http://{s}.tile.openstreetmap.org/{z}/{x}/{y}.png"
    noWrap={true}
  />
  {/* ... */}
</MapContainer>
YAY! We now have our map as a single layer and not as an infinite map! Exactly as we wanted!
Next, to fix the bug which is causing the map go out of the window, we'll need to set the maxBounds and the maxBoundsViscosity for our map!
When maxBounds is set, the map restricts the view to the given geographical bounds, bouncing the user back if the user tries to pan outside the view.
To set maxBounds, we'll need to define 2 points with a certain latitude and longitude using latLng. Then, by using these values, we'll create the bounds using LatLngBound.
First, let's create those 2 variables outside our app component.
const corner1 = Leaflet.latLng(-90, -200); // Here, -90 is the latitude, -200 is the longitude.
const corner2 = Leaflet.latLng(90, 200); // Here, 90 is the latitude, 200 is the longitude.

export default function App() {
  // ...
}
Next, we'll simply create the bounds containing both the points!
const corner1 = Leaflet.latLng(-90, -200);
const corner2 = Leaflet.latLng(90, 200);
const bounds = Leaflet.latLngBounds(corner1, corner2);
Now, to actually set this bounds on our map, we'll pass the maxBounds prop to the MapContainer component and then pass its value as bounds.
<MapContainer
  center={[0, 0]}
  zoom={2}
  minZoom={1.5}
  maxBounds={bounds}
  style={{ height: "100vh", width: "100%" }}
>
Now, we'll also set the maxBoundsViscosity prop in the MapContainer. If maxBounds is set, this option will control how solid the bounds are when dragging the map around. The default value of 0.0 allows the user to drag outside the bounds at normal speed, higher values will slow down map dragging outside bounds, and 1.0 makes the bounds fully solid, preventing the user from dragging outside the bounds.
<MapContainer
  center={[0, 0]}
  zoom={2}
  minZoom={1.5}
  maxBounds={bounds}
  maxBoundsViscosity={0.4}
  style={{ height: "100vh", width: "100%" }}
>
Now if you check your map, we have fixed all the little bugs and its looks much better now!
Your Final Code
import React, { useEffect, useState } from "react";
import { MapContainer, CircleMarker, TileLayer, Tooltip } from "react-leaflet";
import Leaflet from "leaflet";
import "leaflet/dist/leaflet.css";

const url =
  "https://public.opendatasoft.com/api/records/1.0/search/?dataset=geonames-all-cities-with-a-population-1000&q=&lang=EN&rows=50&sort=population&facet=timezone&facet=country";
const corner1 = Leaflet.latLng(-90, -200);
const corner2 = Leaflet.latLng(90, 200);
const bounds = Leaflet.latLngBounds(corner1, corner2);

export default function App() {
  const [cities, setCities] = useState();

  useEffect(() => {
    async function fetchCities() {
      try {
        const res = await fetch(url);
        setCities(await res.json());
      } catch (err) {
        console.error(err);
      }
    }

    fetchCities();
  }, []);

  return (
    <div className="App">
      <h3 style={{ textAlign: "center" }}>
        50 Most Populous Cities in the World
      </h3>
      <MapContainer
        center={[0, 0]}
        zoom={2}
        minZoom={1.5}
        maxBounds={bounds}
        maxBoundsViscosity={0.4}
        style={{ height: "100vh", width: "100%" }}
      >
        <TileLayer
          noWrap={true}
          url="http://{s}.tile.openstreetmap.org/{z}/{x}/{y}.png"
        />

        {cities &&
          cities.records.map((city, i) => {
            return (
              <CircleMarker
                center={[
                  city.fields["coordinates"][0],
                  city.fields["coordinates"][1]
                ]}
                radius={1.5 * (city.fields.population / 1000000)}
                fillOpacity={0.4}
                stroke={true}
                key={city.recordid}
              >
                <Tooltip direction="top" offset={[0, -2]} opacity={1}>
                  <span>
                    {i + 1}. {city.fields.name} : {city.fields.population}
                  </span>
                </Tooltip>
              </CircleMarker>
            );
          })}
      </MapContainer>
    </div>
  );
}
Part 4: The End
Annd we just learnt React Leaflet and built this wonderful map!
Make sure you create an account on CodeSandbox to save this wonderful piece of creation or you'll loose it 😧.
Now it is up to you! Do crazy things with this project!
Here are some helpful links:
Here are some tasks for you:
-
Play around with different types of Tile Layers!
Here is the full list -
Add popups and markers to your map!
Example -
Create a map which shows your location!
Example
Check out these cool examples!
Now that you have finished building it, you should share your beautiful creation with other people! (I can't wait to see you ship this!)
You probably know the best ways to get in touch with your friends and family, but if you want to share your project with the worldwide Hack Club community there is no better place to do that than on Slack.
1. In a new tab, open and follow these directions to signup for our Slack.
2. Then, post the link to the #ship channel to share it with everyone and also ping me!
PS. I'm @fayd on slack.